01
Expand relevant traffic
Product feeds, search intent and a creative-testing system increased the flow of visitors with a reason to buy.
Two growth models · United States
How we build systems that grow sales and turn leads into customers.
Two US businesses. Two growth stories. Explore how we connect strategy, paid media, automation and the sales process — from DTC purchases to paid enrollment.
Free package · 116 slides · 2 growth models
Two separate engagements. Results and measurement scope are explained with each story.
How does your business sell?
US acquisition in context: DTC economics, creative testing, enrollment and follow-up across time zones.
Apparel & footwear · US ecommerce · 24 months
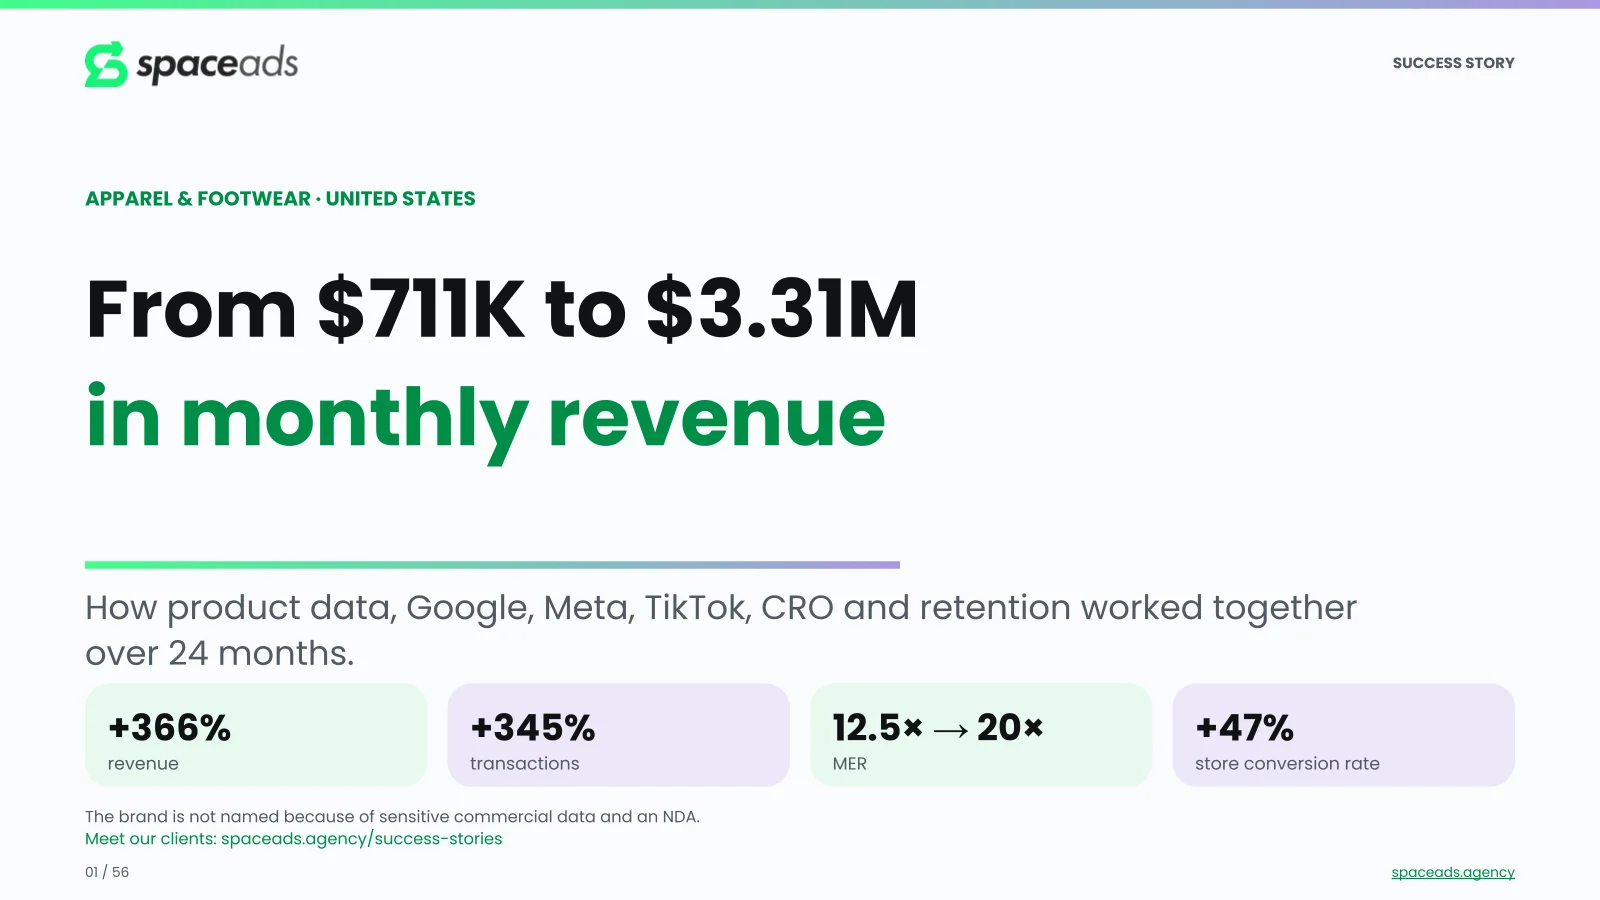
From roughly $711K to $3.31M in monthly revenue. Explore how product data, paid media, creative testing, conversion and retention combined into 4.66× revenue.
+366%
monthly revenue
+345%
monthly transactions
12.5× → 20×
MER: revenue / media
+47%
store conversion rate
The starting point: The store was generating roughly $711K a month, with a 1.51% conversion rate and an average order value of $173.85. Spending more alone was no longer enough. The next stage required stronger product data, more relevant traffic and a better path from visit to purchase.
The decision worth examining
Monthly revenue increased by about 366%, while media spend grew by roughly 191%, derived from the deck's rounded spend shares. MER increased from approximately 12.5× to 20×. The story shows the operating decisions behind the store-level result.
01
Product feeds, search intent and a creative-testing system increased the flow of visitors with a reason to buy.
02
Store CRO and campaign pages connected the ad's promise to the right product. Conversion rose from 1.51% to 2.22%.
03
Relevant bundles and recommendations increased AOV from $173.85 to $182.02, while email and SMS supported repeat purchases.
| Metric | Start | 24 months |
|---|---|---|
| Monthly revenue | $710,854 | $3,311,702 |
| Monthly transactions | 4,089 | 18,194 |
| Store conversion rate | 1.51% | 2.22% |
| Average order value | $173.85 | $182.02 |
| Media share of revenue | 8% | 5% |
| MER: revenue / media spend | ≈12.5× | ≈20× |
Brand anonymized due to sensitive commercial data and an NDA. Start vs month 24; monthly figures. Media spend is derived from rounded 8% / 5% revenue shares. MER means store revenue ÷ media spend; email/SMS costs are separate. Traffic multiple is derived from reported orders and conversion.
Online coding school for kids · 12 months
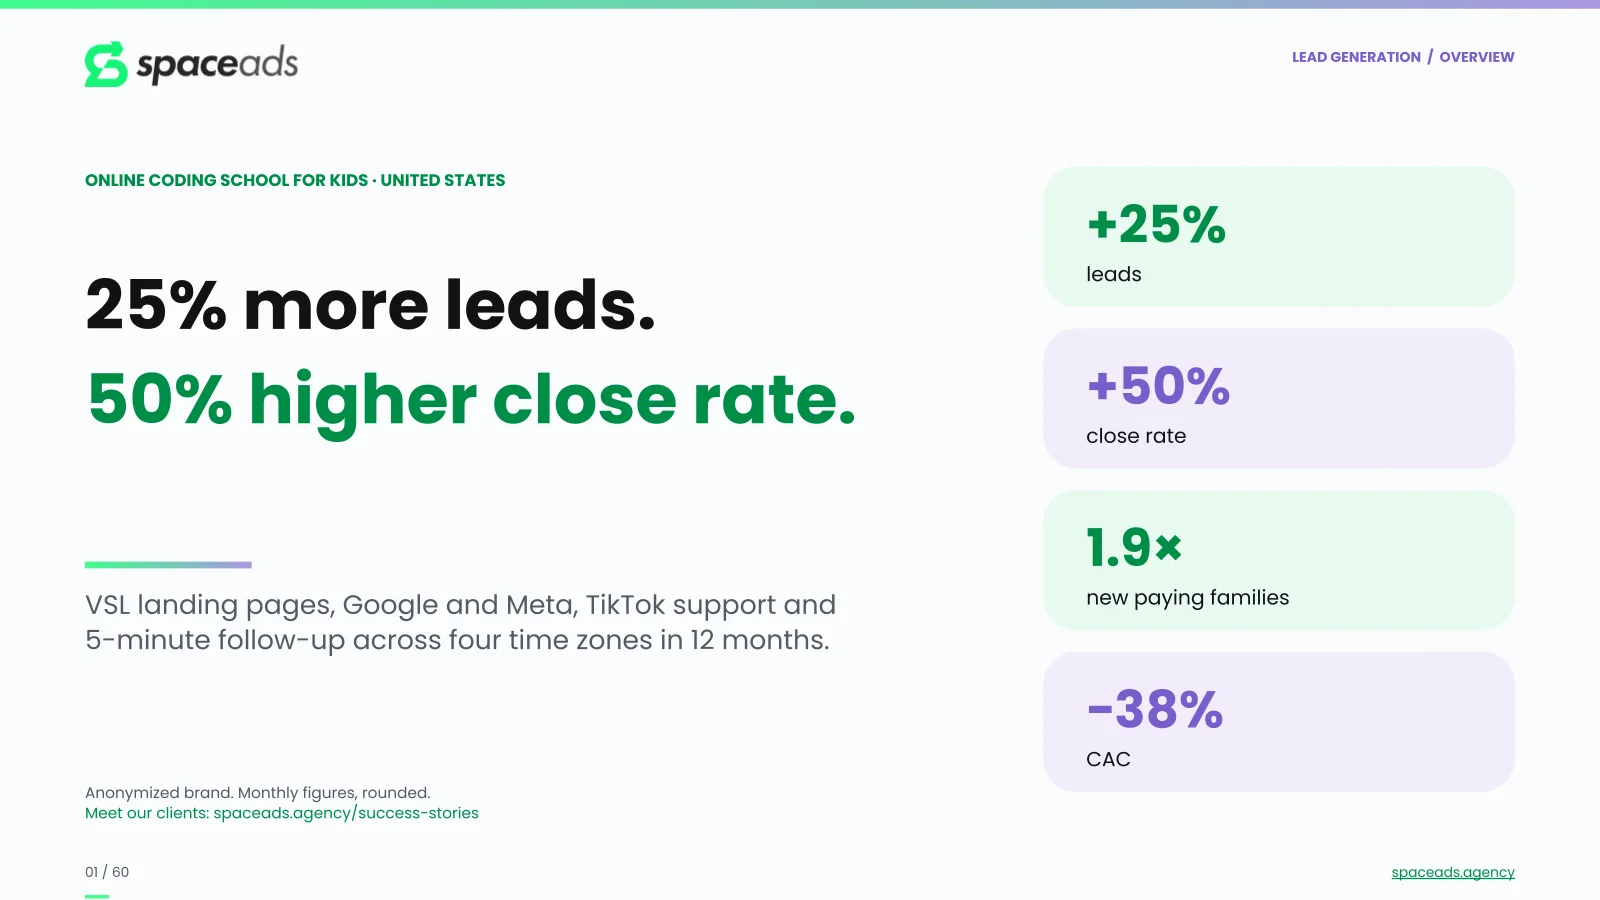
25% more trial sign-ups. 88% more new paying families. See how family-focused pages, five-minute follow-up and scheduling across four time zones improved the journey to enrollment.
+25%
monthly trial sign-ups
+50%
sign-up-to-paid close rate
+88%
new paying families / month
−38%
media CAC
The starting point: The school attracted 4,000 trial sign-ups a month, but only 36% of families attended. First contact took nine hours, and 65% of sign-ups came from instant forms. The next growth opportunity was getting more of the right families to attend and enroll.
The decision worth examining
In the month-12 source comparison, VSL-page sign-ups cost $21 versus $6 for instant forms. Media CAC was lower on the pages: $126 versus $171. The deck explains the offer, booking flow and follow-up behind the difference.
01
Four age- and interest-based pages, clear trial offers and parent-focused creative connected ads to the next step.
02
A call or text within five minutes, trial-slot selection and reminders matched to each family's time zone.
03
The trial-to-paid rate held at 21% while attendance grew. CRM enrollment statuses kept the focus on paying families.
| Metric | Start | 12 months |
|---|---|---|
| New paying families / month | 304 | 570 |
| Trial sign-ups / month | 4,000 | 5,000 |
| Trial show rate | 36% | 54% |
| Sign-up-to-paid close rate | 7.6% | 11.4% |
| Media budget / month | $64.0K | $75.0K |
| Media CAC | $211 | $132 |
Anonymized brand. Month 1 vs month 12; monthly figures, rounded. CAC covers media only; fees, creative and tools are separate. First-year cohort revenue in the deck is not monthly cash receipts. Source comparisons do not isolate the VSL effect.
What connects the two stories?
In ecommerce, orders, order value and repeat purchases matter. In lead-driven sales, qualification, response and closing matter. Paid media, creative, the buying journey and data must support the right stage. That is how we build Space Ads growth systems.
01 / Goal & diagnosis
Revenue, customer volume, efficiency. With a clear starting point and constraints.
02 / The sales journey
Online sales
Traffic → store → purchase → repeat purchase
Paid media · feeds · CRO · email / SMS
Lead-driven sales
Traffic → inquiry → conversation → customer
Paid media · landing pages · CRM · follow-up
03 / Measure & improve
Evaluate the whole journey. Let evidence and business potential guide the next decision.
2 success stories · 116 slides
Follow the complete story for your sales model. Use the companion story to challenge your offer, customer journey and measurement. Both show how strategy becomes day-to-day execution.
Two complete presentations · free
The package covers two separate US engagements: an apparel and footwear ecommerce brand and an online coding school for kids. The second story follows trial sign-up, attendance and paid enrollment — a useful lens for businesses selling through trials, demos or appointments. Two presentations, 116 slides in total. Each covers the starting point, decisions, execution and results.
The industries provide context; the processes help you ask better questions. For online sales, examine traffic, conversion, order value and retention. For sales that require a conversation, examine lead quality, response speed and closing. We adapt the scope to your business model and goal.
These are two separate engagements with different starting points and comparison periods. Revenue is monthly and acquisition costs cover media. Definitions and scope appear with each story. The shared method is diagnosis, prioritisation, execution and evaluation against the business outcome.
We start with your goal, current performance and constraints. Together we identify the opportunity across campaigns, the offer, the buying journey, data, follow-up and retention. Then we define the metrics and scope: a whole growth system or a specific area of ownership.
Space Ads
We build growth systems for businesses. We connect strategy, paid media, creative, technology and data with what happens after the click: a purchase, a conversation, a repeat order.
We can lead the whole system or take ownership of a defined area. Your goal, potential and constraints determine the scope.
Explore more of our client workTell us how you sell and what you want to achieve. Together, we will identify a useful starting point.
Free strategy call · 30 minutes · no obligation