
Ecommerce analytics is the process of measuring, connecting and interpreting data across the full buying journey: traffic, product discovery, cart actions, checkout, purchases, refunds, repeat orders, margin and customer lifetime value. Its goal is not to collect reports. Its goal is to make better decisions about marketing, merchandising, UX, pricing, stock, retention and profitability.
Good ecommerce analytics combines website behavior with business outcomes. GA4 can show how users behave before and during purchase, but it cannot explain profitability by itself. A store also needs order data, ad spend, product margin, returns, customer data, CRM or email data and sometimes warehouse or finance data. Without that wider view, a campaign can look efficient in an ad platform and still be unprofitable after discounts, returns and cost of goods.
TL;DR
- Ecommerce analytics measures the whole purchase journey, not only transactions.
- GA4 ecommerce tracking is a foundation, but it is not the whole truth.
- Key metrics include conversion rate, AOV, ROAS, CAC, LTV, gross margin, checkout abandonment, refunds and repeat purchase rate.
- Recommended GA4 ecommerce events must be implemented correctly. Events such as view_item, add_to_cart, begin_checkout and purchase need consistent item data and required parameters.
- Revenue without margin can mislead decisions. A high-ROAS campaign can still be weak if it sells low-margin products or creates many returns.
- Consent Mode, server-side tagging and data quality affect measurement. They do not replace a good event map and testing process.
- Analytics should end in action. Each report should support a decision about budget, UX, product, offer, pricing or retention.
What ecommerce analytics is
Ecommerce analytics is the structured measurement of how people find, browse, compare and buy products or services online. It includes both marketing analytics and commercial analytics.
It answers questions such as:
- Which channels bring profitable customers?
- Which products attract traffic but do not sell?
- Where do users abandon the buying journey?
- Which product categories generate margin, not only revenue?
- Which campaigns acquire one-time buyers vs repeat customers?
- Which checkout step creates friction?
- Which products have high return rates?
- Which discount strategy increases revenue but reduces profit?
- Which customer segments are worth paying more to acquire?
The point is decision quality. A store with clean analytics can decide where to spend, what to improve and which products to push. A store with weak analytics often optimises for surface metrics.
Ecommerce analytics vs web analytics
Web analytics measures website behavior: sessions, users, pages, events, engagement, traffic sources and conversions.
Ecommerce analytics goes further. It connects behavior with product and financial context:
- product views;
- add-to-cart events;
- cart removals;
- checkout steps;
- purchases;
- transaction value;
- item-level data;
- coupon usage;
- shipping and payment behavior;
- refunds and cancellations;
- product margin;
- customer acquisition cost;
- lifetime value;
- repeat purchases.
A standard analytics setup can show that traffic increased. Ecommerce analytics should show whether the increase created profitable growth.
Core data sources
No single tool gives the complete view.
GA4
GA4 is useful for understanding user behavior, traffic sources, ecommerce events, item-level performance and funnel exploration. It needs properly configured ecommerce events to populate ecommerce reports.
Ecommerce platform
Shopify, WooCommerce, Magento, BigCommerce or a custom platform usually holds the backend order truth: order status, refunds, products, customer accounts, taxes, shipping and payment outcomes.
Advertising platforms
Google Ads, Meta Ads, TikTok Ads and other platforms show campaign cost, attributed conversions, creative performance and bidding data. Their attribution models will not perfectly match GA4 or backend revenue.
Merchant Center and product feeds
Merchant Center and feed tools show product eligibility, feed issues, price and availability mismatches, free listings and Shopping-related product data.
CRM and email platform
CRM, email and marketing automation tools show lead quality, retention, repeat purchase behavior, lifecycle campaigns and customer segments.
Finance and margin data
Finance data is essential for profitability. Revenue is not profit. A proper ecommerce model should account for cost of goods, payment fees, shipping costs, returns, discounts and fulfilment.
The main ecommerce funnel
A practical ecommerce funnel looks like this:
- User arrives from a channel.
- User views a category, search results page or product list.
- User views a product.
- User selects a variant.
- User adds to cart.
- User starts checkout.
- User adds shipping information.
- User adds payment information.
- User completes purchase.
- Order is fulfilled.
- Product is kept, returned or refunded.
- Customer comes back or does not.
Analytics should not stop at step 9. A product that sells well but gets returned often may be a merchandising, sizing, description or quality issue. A campaign that sells once but never creates repeat customers may need a different acquisition target.
Key GA4 ecommerce events
GA4 ecommerce measurement relies on events. Common ecommerce events include:
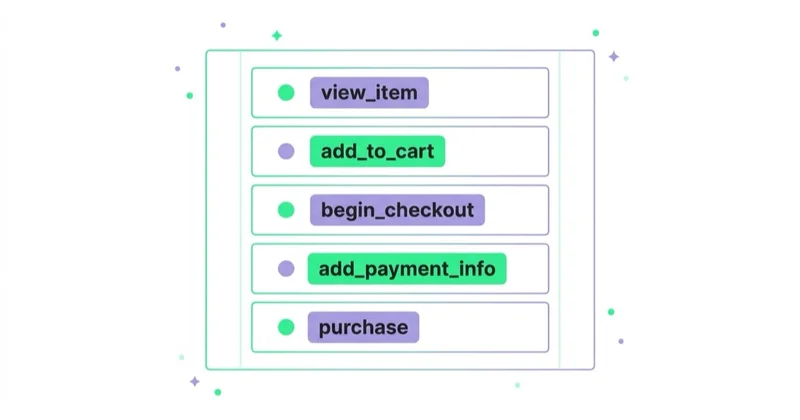
- view_item_list;
- select_item;
- view_item;
- add_to_cart;
- remove_from_cart;
- view_cart;
- begin_checkout;
- add_shipping_info;
- add_payment_info;
- purchase;
- refund;
- view_promotion;
- select_promotion.
For ecommerce reports to work properly, the event name and parameters must follow the GA4 ecommerce model. Purchase events should include a transaction identifier, value, currency and item array. Item data should stay consistent across view, cart, checkout and purchase steps.
Common item parameters include:
- item_id;
- item_name;
- item_brand;
- item_category;
- item_variant;
- price;
- quantity;
- coupon;
- discount.
Small implementation errors can create large reporting problems. For example, if item IDs change between add_to_cart and purchase, product-level funnel analysis becomes unreliable.
Metrics that matter
| Metric | What it shows | Why it matters |
|---|---|---|
| Conversion rate | Share of users or sessions that buy | Measures how effectively traffic turns into orders |
| AOV | Average order value | Shows basket size and upsell/cross-sell effect |
| Revenue | Sales value | Useful but incomplete without cost and margin |
| Gross margin | Revenue minus product cost | Shows whether sales create room for profit |
| ROAS | Revenue divided by ad spend | Useful for ad efficiency, but incomplete alone |
| CAC | Cost to acquire a customer | Shows acquisition economics |
| LTV | Customer value over time | Helps decide how much can be spent to acquire users |
| Cart abandonment | Drop-off after cart | Identifies friction before checkout |
| Checkout abandonment | Drop-off during checkout | Highlights payment, shipping, UX or trust issues |
| Refund rate | Share of orders refunded | Corrects revenue quality |
| Repeat purchase rate | Share of customers buying again | Measures retention and customer quality |
| Contribution margin | Profit after variable costs | Better for scaling decisions than revenue alone |
No metric is universal. A good conversion rate depends on traffic source, price point, category, device, market, brand demand, stock availability and purchase complexity.
Why ROAS is not enough
ROAS is useful, but it can be dangerous when treated as the main business truth.
Example:
- Campaign A: ROAS 6.0, low-margin products, high return rate.
- Campaign B: ROAS 3.5, high-margin products, high repeat purchase rate.
Campaign A may look better in Google Ads. Campaign B may create better business value.
A better evaluation includes:
- ad spend;
- gross margin;
- discount level;
- refund rate;
- shipping cost;
- payment fees;
- first-order vs repeat-order mix;
- lifetime value;
- new customer share;
- stock constraints.
The more mature the store, the more analytics should move from "which campaign has the highest ROAS?" to "which investment creates profitable customers?"
GA4 vs backend: why numbers differ
GA4 revenue often differs from ecommerce platform revenue. Some difference is normal.
Reasons include:
- cookie consent choices;
- ad blockers;
- browser restrictions;
- purchase event not firing;
- payment gateway redirects;
- duplicate transaction IDs;
- missing transaction IDs;
- refunds handled differently;
- taxes and shipping included in one system but not another;
- currency conversions;
- internal traffic filters;
- time zone differences;
- attribution model differences;
- cancelled orders;
- offline or manual orders.
The goal is not perfect equality. The goal is a known, monitored difference. If GA4 captures 92 percent of backend orders consistently, that may be workable. If it captures 55 percent one week and 95 percent the next, there is a measurement problem.
Consent Mode and measurement quality
Consent Mode helps Google tags adjust behavior based on user consent. In basic mode, tags can be blocked until consent is given. In advanced mode, Google tags can load with default denied consent and send cookieless pings until consent is updated.
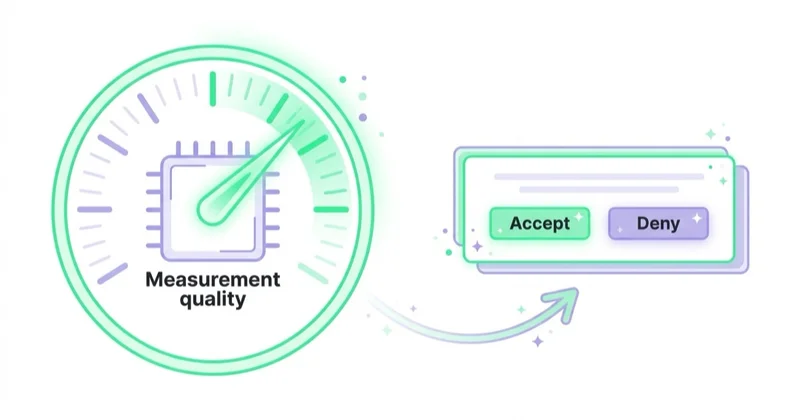
For ecommerce analytics, consent implementation affects:
- observed event volume;
- conversion modeling;
- remarketing eligibility;
- Google Ads conversion data;
- GA4 reporting completeness;
- country-level and domain-level differences.
Consent Mode is not a substitute for legal advice, a proper CMP or a clean event implementation. It is part of a measurement architecture. Every ecommerce team should test what fires before consent, after consent, after rejection and during checkout.
For more detail, read Consent Mode v2: What It Is and How to Implement It.
Server-side tagging
Server-side tagging uses a server container between the website and analytics or advertising endpoints. It can help screen, validate and modify data before it is sent onward.
It can be useful for:
- improving control over data collection;
- reducing reliance on browser-side scripts;
- standardising event payloads;
- enriching events with server-known data;
- filtering sensitive or unnecessary fields;
- supporting conversion APIs and enhanced conversion setups;
- improving resilience in some measurement scenarios.
It is not magic. It still needs consent logic, event design, QA and documentation. A bad client-side event sent to a server-side container is still a bad event.
How to analyse the funnel
Product view to add to cart
Low add-to-cart rate may indicate:
- weak product description;
- poor product images;
- unclear price;
- missing variant information;
- poor availability;
- weak trust signals;
- unclear delivery or returns;
- mismatch between ad and product page;
- product not competitive.
This is where product content, pricing and merchandising usually matter.
Add to cart to checkout
Drop-off after cart may indicate:
- delivery cost surprise;
- unclear free shipping threshold;
- coupon field distraction;
- poor cart UX;
- slow page speed;
- forced account creation;
- lack of payment options;
- cross-sells getting in the way.
Cart analytics should be paired with session recordings, user testing or qualitative feedback where possible.
Checkout to purchase
Checkout abandonment may indicate:
- payment method issues;
- form errors;
- address validation problems;
- slow payment redirect;
- hidden fees;
- lack of trust;
- delivery time concerns;
- technical errors;
- mobile usability issues.
Checkout changes should be tested carefully because they affect revenue directly.
Purchase to repeat purchase
The first purchase is only part of ecommerce growth.
Analyse:
- time to second order;
- repeat purchase rate by product;
- email and SMS retention;
- subscription behaviour;
- product replenishment cycle;
- returns by first-order product;
- customer service issues;
- cohort revenue.
Retention can change the acceptable CAC. A channel that looks expensive on first purchase may be profitable when repeat purchases are included.
Segmentation that improves decisions
Do not analyse the whole store as one average.
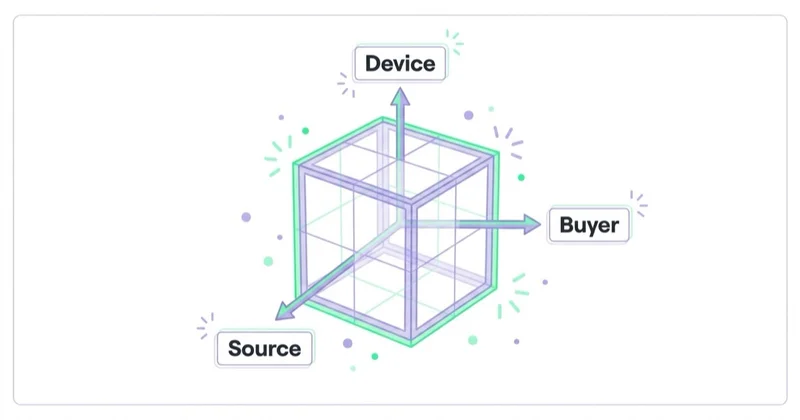
Segment by:
- traffic channel;
- new vs returning users;
- device;
- country or region;
- product category;
- brand;
- margin group;
- price range;
- acquisition campaign;
- discount usage;
- customer cohort;
- first product purchased;
- payment method;
- shipping method.
A store average can hide problems. Mobile conversion may be weak while desktop looks strong. A category may generate revenue but low margin. A paid channel may bring new users while email drives repeat revenue.
Analytics by store size
Small store
A small store needs a clean, practical setup:
- GA4 ecommerce events;
- Google Ads and Meta Ads conversions;
- clear UTM rules;
- basic Looker Studio dashboard;
- backend vs GA4 transaction comparison;
- conversion rate and AOV monitoring;
- checkout error checks;
- product and category performance.
The goal is clarity, not complexity.
Growing store
A growing store should add:
- customer segmentation;
- new vs returning customer reporting;
- gross margin by product or category;
- refund analysis;
- retention cohorts;
- email performance;
- product feed diagnostics;
- server-side or enhanced conversion planning;
- documented measurement plan.
The goal is to understand profitability and scaling constraints.
Large store
A large store may need:
- BigQuery export;
- data warehouse;
- product margin tables;
- CRM and order data integration;
- attribution modelling;
- LTV modelling;
- cohort analysis;
- category-level dashboards;
- forecasting;
- data quality monitoring;
- separate views for marketing, merchandising, finance and leadership.
The goal is decision infrastructure.
Dashboard structure
A useful ecommerce dashboard should not be one giant screen.
Use separate views:
Executive view
- revenue;
- gross margin;
- orders;
- CAC;
- LTV;
- contribution margin;
- new customer revenue;
- repeat customer revenue;
- return rate.
Marketing view
- channel performance;
- campaign spend;
- ROAS;
- CAC;
- conversion rate by channel;
- new customer share;
- assisted conversions;
- landing page performance.
Product view
- product revenue;
- product margin;
- add-to-cart rate;
- purchase rate;
- stock availability;
- refund rate;
- category performance;
- feed issues.
UX and checkout view
- funnel step drop-off;
- cart abandonment;
- checkout abandonment;
- payment method performance;
- device split;
- page speed indicators;
- form errors where available.
Retention view
- repeat purchase rate;
- cohort revenue;
- time to second purchase;
- email revenue;
- subscription metrics;
- customer segment value.
For dashboard implementation, see How to Use Google Data Studio (Looker Studio).
Data quality checklist
Before trusting ecommerce reports, check:
- Is GA4 installed once, not duplicated?
- Are ecommerce events firing on the right actions?
- Does purchase fire only after confirmed order?
- Is transaction_id unique?
- Are value and currency present?
- Does the items array include product ID and name?
- Are item IDs consistent across funnel events?
- Are refunds tracked or imported?
- Are test orders excluded or labelled?
- Is internal traffic filtered correctly?
- Does Consent Mode behave as expected?
- Are Google Ads and GA4 conversions aligned intentionally?
- Are UTM rules documented?
- Is checkout tested after platform or CMP changes?
- Are backend orders compared with GA4 purchases regularly?
For broader implementation review, read What Is a Google Analytics Audit and Is It Worth Doing?.
How we approach this at Space Ads
At Space Ads, we start ecommerce analytics with the decisions the store needs to make: which products deserve budget, where checkout friction appears, which campaigns bring profitable customers and which categories create margin after returns and discounts. We verify purchase events, transaction IDs, value, currency, item IDs, consent states and backend reconciliation before treating reports as decision data. Then we connect GA4 with ad costs, feed diagnostics, product availability, margin, refund patterns and retention. This keeps optimisation grounded: scale campaigns that sell the right products to the right customers, fix product or checkout issues when traffic is not the constraint and avoid judging growth by platform ROAS alone.
Common mistakes
| Mistake | Why it hurts | Better approach |
|---|---|---|
| Looking only at revenue | Ignores costs and margin | Add margin, refunds and CAC |
| Looking only at ROAS | Overvalues short-term attributed revenue | Use contribution margin and LTV |
| No transaction_id | Purchases may duplicate or be hard to reconcile | Send a unique order ID |
| Missing currency | Revenue can be misread | Always send currency with value |
| Inconsistent item IDs | Product funnel reports break | Keep item_id stable across events |
| No backend comparison | Tracking problems stay hidden | Reconcile GA4 and order system |
| Ignoring refunds | Revenue is overstated | Track refunds and cancellations |
| No consent QA | Data gaps become mysterious | Test consent states and tag firing |
| One dashboard for everyone | Nobody gets the right decisions | Split views by audience |
| No action after reporting | Analytics becomes theatre | Connect each report to decisions |
FAQ
What is ecommerce analytics?
Ecommerce analytics is the measurement and interpretation of data across the online buying journey, from traffic and product views to checkout, purchases, refunds, repeat orders and customer lifetime value.
Is GA4 enough for ecommerce analytics?
GA4 is a foundation, but it is not enough by itself. A store should also use backend order data, ad platform costs, product margin, refunds, CRM or email data and customer retention data.
Which ecommerce metrics matter most?
The most useful metrics are conversion rate, AOV, revenue, gross margin, ROAS, CAC, LTV, checkout abandonment, refund rate and repeat purchase rate.
Why does GA4 revenue not match Shopify, WooCommerce or Magento?
GA4 and ecommerce platforms collect data differently. Differences can come from consent, ad blockers, failed tags, payment redirects, refunds, cancelled orders, duplicated transaction IDs, time zones and attribution models.
What GA4 events should an ecommerce store track?
Common ecommerce events include view_item, add_to_cart, remove_from_cart, view_cart, begin_checkout, add_shipping_info, add_payment_info, purchase and refund.
Should ecommerce analytics include margin?
Yes. Revenue and ROAS can mislead without margin. Product cost, shipping, discounts, payment fees and returns can completely change the profitability of a campaign or category.
Does Consent Mode fix lost ecommerce tracking?
No. Consent Mode helps Google tags adjust behavior based on consent and can support modeling, but it does not fix bad event implementation, broken checkout tracking or missing transaction data.
What should be checked first in an ecommerce analytics audit?
Start with purchase tracking: transaction_id, value, currency, items, deduplication and backend reconciliation. Then check funnel events, consent behavior, ad conversions and UTM rules.
Conclusion
Ecommerce analytics is valuable only when it improves decisions. A store does not need more reports for their own sake. It needs trustworthy answers about traffic quality, product demand, checkout friction, campaign profitability, repeat purchasing and customer value.
GA4 ecommerce tracking is an important foundation, but it must be connected to backend orders, ad costs, margin, refunds and retention. The best ecommerce teams do not ask only "what happened?" They ask "what should change next?"
That is the difference between collecting ecommerce data and using ecommerce analytics as a growth system.
Sources and further reading
- Google Analytics Help: Ecommerce purchases report
- Google Analytics Help: Ecommerce in Google Analytics
- Google Analytics Help: Ecommerce events
- Google Analytics Help: About ecommerce metrics
- Google Analytics Developers: Recommended events
- Google Analytics Help: Set up consent mode
- Google Tag Manager Help: Client-side tagging vs server-side tagging
Continue learning
- Google Analytics 4 (GA4): Why Implement It and What Are the Benefits?
- What Is a Google Analytics Audit and Is It Worth Doing?
- What Are UTM Parameters and How to Create UTM URLs for Google Analytics?
- Consent Mode v2: What It Is and How to Implement It
- How to Use Google Data Studio (Looker Studio)
- How to Audit an Ecommerce Store
Continue reading

Google Analytics MCP Server: Connect AI to GA4 Safely
Google Analytics MCP is Google's official read-only server for connecting AI to GA4 through the Admin API and Data API. This guide explains when it speeds up ad-hoc analysis, how to verify model answers and why clean events, UTM discipline and consent-aware measurement still decide whether the output is usable.

What Are UTM Parameters and How to Create UTM URLs for Google Analytics?
UTM parameters help Google Analytics identify campaign traffic from email, social, partners, QR codes and other external links when they are used with a clear naming convention.
What Is Bounce Rate and How to Optimize It?
Bounce rate in GA4 is the share of sessions that were not engaged, but the number only becomes useful when it is tied to page intent, traffic source, device, events and business outcomes. This guide explains the GA4 definition, why Universal Analytics comparisons fail and how to diagnose bounce on landing pages, ecommerce pages, blog posts and lead-generation journeys.


































