
Bounce rate in GA4 is the percentage of sessions that were not engaged. It is the opposite of engagement rate, which means a GA4 bounce is not the same thing as the old Universal Analytics bounce. In GA4, an engaged session is a session that lasts longer than 10 seconds, has a key event or includes 2 or more pageviews or screenviews.
A high bounce rate is not automatically bad. It depends on page intent. A contact page, short definition, support answer or opening-hours page can satisfy the user without a second pageview. A paid landing page, product page, category page or lead-generation page with high bounce and weak conversion usually needs diagnosis.
TL;DR
- Bounce rate in GA4 means the percentage of sessions that were not engaged.
- Engagement rate and bounce rate are opposites in GA4. If engagement rate is 65%, bounce rate is 35%.
- An engaged session lasts longer than 10 seconds, has a key event or has 2 or more pageviews or screenviews.
- Do not compare Universal Analytics bounce rate with GA4 bounce rate directly. The definitions are different.
- High bounce rate can be normal when the page answers a simple query or contact intent.
- High bounce rate is a problem when the page should lead to a click, lead, purchase, signup or deeper journey and users leave without engaging.
- Optimisation should focus on intent match, speed, mobile UX, first screen clarity, CTA quality, internal links and measurement.
What bounce rate means in GA4
Bounce rate is often misunderstood because the definition changed with Google Analytics 4.
In GA4, engagement rate is the percentage of engaged sessions. Bounce rate is the percentage of sessions that were not engaged.
Google defines an engaged session as one that meets any of these conditions:
- lasts longer than 10 seconds;
- has a key event;
- has 2 or more pageviews or screenviews.
That means a user can view one page and still be counted as engaged if the session lasts longer than 10 seconds or includes a key event. This is a major difference from Universal Analytics, where bounce rate was mainly associated with single-page sessions.
GA4 bounce rate vs Universal Analytics bounce rate
| Area | Universal Analytics | GA4 |
|---|---|---|
| Core definition | Single-page session without another interaction hit | Session that was not engaged |
| Engagement threshold | Not defined in the same way | More than 10 seconds, key event or 2+ pageviews/screenviews |
| One-page session can be engaged | Usually no, unless interaction tracking was configured | Yes |
| Main engagement metric | Bounce rate | Engagement rate plus bounce rate |
| Direct comparison with GA4 | No | No |
The practical consequence is simple: old bounce rate benchmarks are often misleading. A site can appear to have "improved" or "worsened" after migration to GA4 even when user behaviour did not change in the same way.
For GA4 foundations, read Google Analytics 4: Why Implement It and What Are the Benefits?.
Why bounce rate still matters
Bounce rate is not a perfect metric, but it can still be useful as a diagnostic signal.
It helps answer:
- Are users engaging with the page after landing?
- Do certain channels send low-quality traffic?
- Does mobile traffic behave worse than desktop?
- Do paid campaigns match landing page intent?
- Do blog posts lead users to useful next steps?
- Are product pages failing before add to cart?
- Did a redesign, tracking change or speed issue affect engagement?
Bounce rate should not be the final verdict. It should trigger better questions.
When high bounce rate is a problem
High bounce rate needs attention when the page has a clear next action and users do not take it.
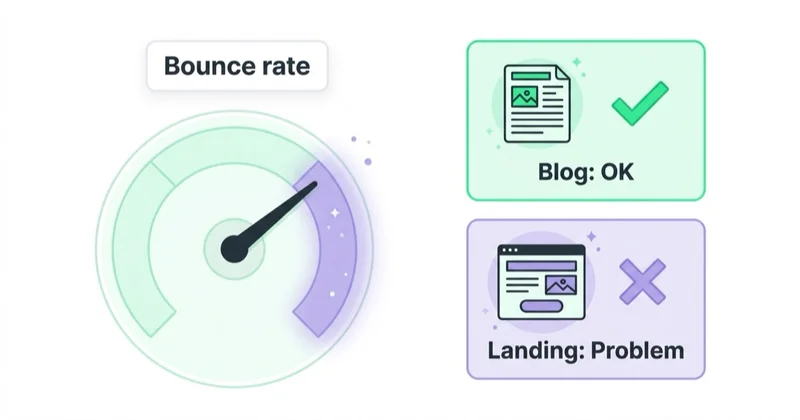
Typical problem cases:
- paid landing page with high spend and low engagement;
- service page with weak form submissions;
- ecommerce category page where users do not click products;
- product page where users do not choose variants or add to cart;
- SaaS landing page where users do not request demo or start trial;
- blog article that attracts traffic but never moves readers to related content;
- page with strong impressions but weak clicks or poor engagement after click;
- mobile page where users leave quickly because the layout or speed is poor.
The issue may be traffic quality, message mismatch, slow loading, poor content hierarchy, weak CTA, intrusive pop-ups, confusing navigation, lack of proof or a broken measurement setup.
When high bounce rate is not a problem
High bounce rate can be normal when the page completes the task immediately.
Examples:
- contact page where users copy the phone number;
- local page where users check opening hours;
- help article that answers one specific question;
- glossary page with a short definition;
- recipe or instruction page where users read and leave;
- blog post that satisfies an informational query;
- status page or documentation page.
In these cases, lower bounce rate is not always a meaningful goal. Better metrics might include click-to-call, email click, scroll depth, copy interaction, average engagement time, form start, file download, support deflection or return visits.
How to analyse bounce rate properly
1. Segment by page type
Do not use one benchmark for all pages.
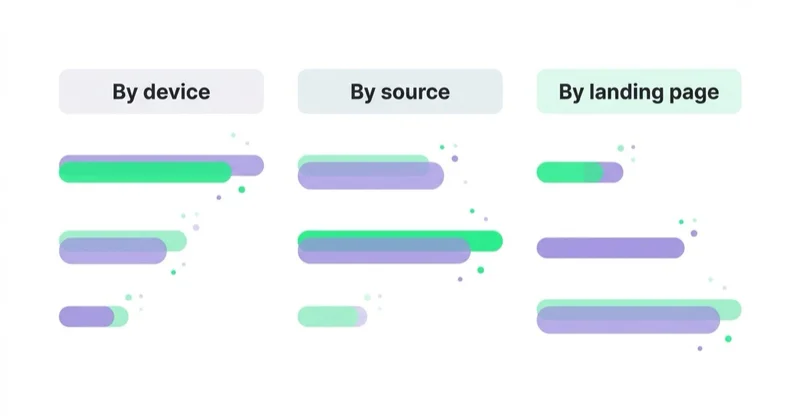
Compare:
- homepage vs homepage;
- service pages vs service pages;
- product pages vs product pages;
- category pages vs category pages;
- blog posts vs blog posts;
- landing pages vs landing pages;
- help pages vs help pages.
A high bounce rate on a definition article may be acceptable. The same number on a paid lead-generation page may be expensive.
2. Segment by traffic source
Bounce rate often differs by source.
Look separately at:
- organic search;
- paid search;
- paid social;
- organic social;
- email;
- referral;
- direct;
- display;
- remarketing.
If paid social has high bounce, the creative may be attracting curiosity rather than qualified intent. If paid search has high bounce, query intent and landing page relevance should be checked. If organic traffic has high bounce, the page may answer the query quickly or may not satisfy intent deeply enough.
3. Segment by device
Mobile bounce problems are common.
Check:
- mobile load speed;
- first screen clarity;
- sticky elements;
- consent banner size;
- form usability;
- tap target spacing;
- content readability;
- product image loading;
- checkout friction;
- intrusive pop-ups.
A page that looks fine on desktop can be difficult to use on mobile.
4. Connect bounce rate with conversions
Bounce rate alone does not show business value.
Pair it with:
- key event rate;
- conversion rate;
- form starts;
- form completions;
- add to cart;
- checkout start;
- purchase;
- revenue;
- lead quality;
- average engagement time;
- scroll depth;
- CTA clicks.
If bounce rate is high but conversions are strong, it may not be a priority. If bounce rate is high and conversions are weak, it deserves investigation.
For conversion context, read What Is Conversion Rate and How to Increase It?.
How to optimise bounce rate
1. Match the page to the promise
The first screen should confirm that the user arrived in the right place.
Check the match between:
- ad copy and landing page;
- search query and title;
- meta description and opening section;
- social creative and page content;
- email link and page expectation.
If the ad promises a GA4 audit but the landing page begins with a generic history of analytics, users may leave before seeing the relevant offer.
2. Improve page speed and Core Web Vitals
Slow pages increase the chance that users leave before engaging.
Review:
- LCP for main content loading;
- INP for interaction responsiveness;
- CLS for layout stability;
- heavy images;
- third-party scripts;
- font loading;
- server response time;
- unused JavaScript;
- mobile performance.
Speed work should focus on user experience, not only a score. A faster first meaningful experience usually helps engagement.
3. Make the first screen useful
The first screen should answer:
- what this page is about;
- why it is relevant;
- what the user can do next;
- whether the page matches the query or ad.
For an article, this may be a direct answer and a useful TL;DR. For a service page, it may be a clear value proposition, proof and CTA. For a product page, it may be product name, price, availability, image, delivery and trust information.
4. Add meaningful next steps
Many pages have high bounce because they give users nowhere useful to go.
Possible next steps:
- related articles;
- service page links;
- product recommendations;
- comparison pages;
- FAQ sections;
- lead magnets;
- newsletter signup;
- calculator;
- demo CTA;
- contact option;
- internal search;
- category navigation.
Internal links should be relevant. Adding random links can reduce bounce artificially but hurt user experience.
5. Reduce friction
Common friction points:
- intrusive pop-ups;
- consent banners covering the page;
- slow-loading hero video;
- unclear navigation;
- tiny mobile text;
- broken forms;
- too many fields;
- hidden pricing;
- missing trust signals;
- unclear delivery or returns;
- layout shifts.
For pop-up UX, read How to Use Pop-Ups Without Hurting UX or SEO.
6. Measure the right events
Some pages look like they have poor engagement because key actions are not measured.
Examples:
- phone clicks on local service pages;
- email clicks on contact pages;
- scroll depth on long guides;
- video play on product pages;
- filter use on category pages;
- variant selection on product pages;
- quote calculator interactions;
- file downloads;
- outbound booking clicks.
Measurement should reflect the page's purpose. For implementation structure, read What Is Google Tag Manager and How to Use It?.
Bounce rate by page type
| Page type | What high bounce may mean | Better supporting metrics |
|---|---|---|
| Blog post | Answer complete, weak internal links or wrong intent | Scroll, engagement time, CTA clicks, related article clicks |
| Service page | Weak relevance, unclear offer or missing proof | Form starts, calls, CTA clicks, qualified leads |
| Product page | Missing trust, weak images, price issue or unavailable variants | Add to cart, variant clicks, image views, purchase rate |
| Category page | Poor filters, weak product relevance or slow loading | Product clicks, filter use, revenue, scroll |
| Contact page | User found phone or address quickly | Phone clicks, email clicks, map clicks |
| Paid landing page | Message mismatch or poor traffic quality | Key event rate, cost per lead, lead quality |
The same bounce rate number can mean different things across these pages. Context is everything.
Bounce rate in ecommerce
For ecommerce, bounce rate should be analysed by template and product intent.
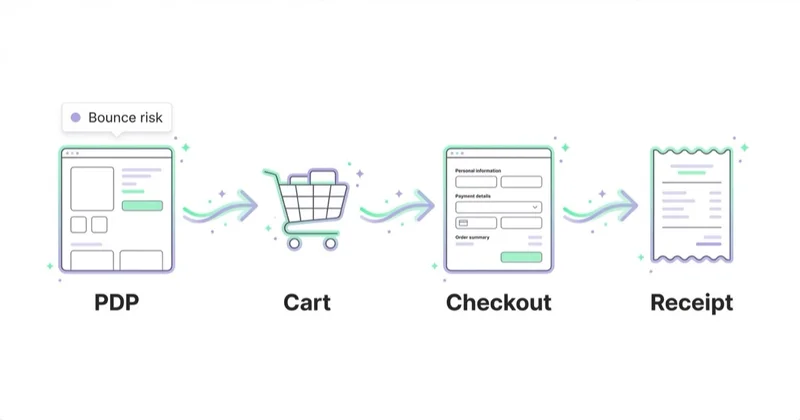
Focus on:
- category pages;
- product pages;
- search results pages;
- cart pages;
- checkout;
- content pages that assist shopping;
- paid campaign landing pages.
Common ecommerce causes:
- products out of stock;
- weak product images;
- unclear delivery cost;
- price mismatch;
- slow mobile page;
- missing reviews;
- poor filters;
- irrelevant traffic;
- product page not matching ad promise;
- intrusive discount pop-up.
Pair bounce rate with revenue, add-to-cart rate, checkout starts, purchase rate, margin and product availability. A high-bounce page with no stock is a merchandising issue, not only a UX issue.
For deeper ecommerce measurement, read What Is Ecommerce Analytics and Why Is It So Important?.
Bounce rate in B2B and lead generation
B2B pages often have longer consideration journeys. A user may read one page, leave, discuss internally and return later.
Useful supporting metrics:
- scroll depth;
- case study clicks;
- pricing page visits;
- demo CTA clicks;
- form starts;
- form completions;
- lead quality;
- CRM stage progression;
- return visits;
- content-assisted conversions.
Do not optimise B2B pages only for lower bounce. Optimise them for clearer qualification, better trust and stronger next steps.
How we approach this at Space Ads
At Space Ads, we do not treat bounce rate as a standalone score. We first check whether GA4 events, consent setup and key events are reliable, then segment by page type, device, source and campaign promise. For paid traffic, we compare bounce with query or creative intent, first-screen relevance, speed, CTA behaviour and lead or order quality. For SEO content, we ask whether the page actually needs a next step or whether it has already satisfied the query. The useful outcome is a clear decision: fix traffic quality, improve the page experience, add a relevant next step or leave the metric alone because it is not limiting growth.
Common mistakes
| Mistake | Why it hurts | Better approach |
|---|---|---|
| Comparing UA and GA4 directly | Definitions changed | Rebuild benchmarks in GA4 |
| Using one "good bounce rate" number | Page intent differs | Segment by page type and source |
| Treating high bounce as always bad | Some pages satisfy intent quickly | Measure the page's real job |
| Ignoring mobile | Averages hide device problems | Analyse device separately |
| Looking only at bounce | No business context | Pair with conversions and engagement |
| Trying to lower bounce artificially | Can harm UX | Add useful next steps, not random interactions |
| Forgetting tracking QA | Events may be missing | Audit tags and key events |
FAQ
What is bounce rate in GA4?
Bounce rate in GA4 is the percentage of sessions that were not engaged. A session is engaged if it lasts longer than 10 seconds, has a key event or includes 2 or more pageviews or screenviews.
Is bounce rate the opposite of engagement rate?
Yes. In GA4, bounce rate is the opposite of engagement rate. If engagement rate is 70%, bounce rate is 30%.
Is high bounce rate always bad?
No. It depends on page intent. A page can have high bounce and still satisfy the user if the goal is a quick answer, phone number, address or single piece of information.
What is a good bounce rate?
There is no universal good bounce rate. Compare similar pages, sources, devices and periods. Trends and business outcomes are more useful than generic benchmarks.
How can bounce rate be reduced?
Improve intent match, page speed, mobile UX, first screen clarity, CTA relevance, internal links, content quality and tracking. Start by diagnosing where the bounce occurs and which audience or page type is affected.
Why did bounce rate change after moving to GA4?
GA4 uses a different definition from Universal Analytics. GA4 bounce rate is based on engaged sessions, so historical UA benchmarks should not be compared directly.
Should blog posts have a low bounce rate?
Not always. A blog post may answer the query fully. Better goals may be engaged reading, related article clicks, newsletter signup, service-page clicks or assisted conversions.
Conclusion
Bounce rate is useful only when interpreted with intent. In GA4, it means sessions without engagement, not simply one-page visits. That makes it more useful in some ways and less comparable with old Universal Analytics reports.
The right question is not "how to reduce bounce rate everywhere?" The better question is "which pages should lead to a next step, and why are users not taking it?"
Optimise the experience: match the promise, load quickly, make the first screen clear, remove friction, measure meaningful events and give users useful next steps. A lower bounce rate is valuable only when it reflects better engagement and better business outcomes.
Sources and further reading
- Google Analytics Help: Engagement rate and bounce rate
- Google Analytics Help: User engagement
- web.dev: Web Vitals
- Google Search Console Help: Core Web Vitals report
- Google Analytics Help: About Analytics sessions
Continue learning
- Google Analytics 4: Why Implement It and What Are the Benefits?
- What Is a Google Analytics Audit and Is It Worth Doing?
- What Is Ecommerce Analytics and Why Is It So Important?
- What Is Conversion Rate and How to Increase It?
- What Is Conversion Rate Optimization (CRO) and How Does It Increase Sales?
- What Is Google Tag Manager and How to Use It?
- How to Use Google Search Console for SEO
Continue reading

Google Analytics MCP Server: Connect AI to GA4 Safely
Google Analytics MCP is Google's official read-only server for connecting AI to GA4 through the Admin API and Data API. This guide explains when it speeds up ad-hoc analysis, how to verify model answers and why clean events, UTM discipline and consent-aware measurement still decide whether the output is usable.
What Is Ecommerce Analytics and Why Is It So Important?
Ecommerce analytics should connect GA4 events, backend orders, ad costs, product margin, refunds, stock, retention and LTV so decisions are based on profit quality, not only revenue. This guide explains what to measure, how to QA data and how to turn ecommerce reports into budget, UX, feed and merchandising actions.

Source / Medium and Traffic Sources in GA4, Explained
Source and medium describe traffic origin in GA4, but their meaning changes with user, session and event scope. Learn how UTMs, auto-tagging, channel groups, Direct, Unassigned and cross-domain tracking work.


































