
A marketing dashboard is a decision view that connects marketing activity to business outcomes. It should show what the team spent, where demand came from, how channels performed, whether conversions were valuable and what should change next. A good marketing dashboard does not simply restate Google Ads, Meta Ads, TikTok, GA4 and CRM numbers in one place. It reconciles them into a view the business can use.
The most useful dashboards are built around decisions, not charts. Growth teams need to know whether spend is on pace, whether customer acquisition is efficient, which channels are creating value, where conversion quality is weak and whether sales or retention is improving the economics. If the dashboard cannot help answer those questions, it is probably a reporting decoration.
TL;DR
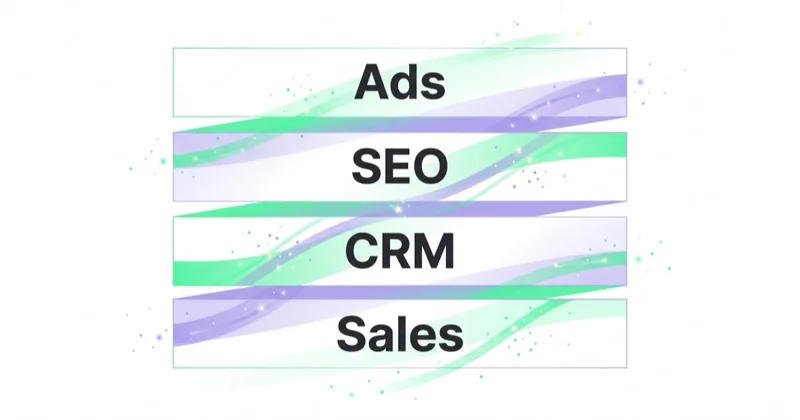
- A marketing dashboard should connect ads, SEO and sales. Platform metrics are useful, but the headline view should map to revenue, pipeline, qualified leads or customer value.
- Dashboards should not add platform conversions together. Google, Meta and TikTok use different attribution logic, so totals need reconciliation through GA4, CRM or business data.
- The best dashboard has a fixed spine. Spend, pacing, blended efficiency, channel contribution, conversion quality, anomalies and next actions.
- Different teams need different layers. Executives need business outcomes; specialists need campaign and diagnostic detail.
- CRM feedback is essential for lead generation. A lead dashboard should show sales acceptance, opportunity rate and pipeline, not only form volume.
- SEO belongs in the dashboard. Search Console, organic landing pages and assisted conversions show whether content supports acquisition.
- At Space Ads, dashboard work is operational. Client dashboards are connected to advertising and analytics data pipelines so reporting can support daily decisions, not only monthly decks.
What a marketing dashboard should do
A marketing dashboard should answer five questions:
- Are we spending as planned?
- Is acquisition efficient overall?
- Which channels are creating useful demand?
- Are conversions turning into business value?
- What should change next?
That is different from showing every possible metric. A dashboard with 80 charts can still fail if it does not produce a decision. A dashboard with 12 well-chosen sections can support weekly budget, creative, SEO and sales decisions.
For a broader reporting context, see marketing reporting in 2026 and ad management software.
Dashboard vs report vs analytics tool
| Tool | Main job | Best user |
|---|---|---|
| Dashboard | Always-on view of current performance | Growth team, client, management |
| Report | Periodic explanation of what happened and what changes next | Stakeholders, board, client |
| Analytics tool | Exploratory investigation | Specialist, analyst |
| Ad platform | Channel management and optimization | Media buyer |
| CRM | Sales and pipeline truth | Sales team, management |
The dashboard should not replace deep analysis. It should tell the team where to look. If blended CPA rises, the dashboard should show whether the issue is traffic cost, conversion rate, channel mix, lead quality, sales acceptance or revenue per customer.
The dashboard spine
Strong marketing dashboards usually have a consistent structure.
| Section | Question | Example metrics |
|---|---|---|
| Spend and pacing | Are budgets on plan? | spend, budget, pacing, forecast |
| Blended outcome | Is marketing efficient overall? | MER, blended ROAS, blended CPA, CAC |
| Channel contribution | Where is demand coming from? | Google, Meta, TikTok, SEO, direct, email |
| Conversion quality | Are conversions valuable? | qualified leads, sales accepted leads, purchases, activation |
| Funnel health | Where is the leak? | landing conversion rate, checkout drop-off, meeting rate |
| Creative / content | What message is working? | top ads, top pages, winning angles |
| Anomalies | What changed unexpectedly? | tracking drop, spend spike, conversion lag, disapprovals |
| Next actions | What changes now? | budget move, test, tracking fix, page update |
This spine keeps the dashboard from becoming a pile of disconnected widgets.
What to track across paid media
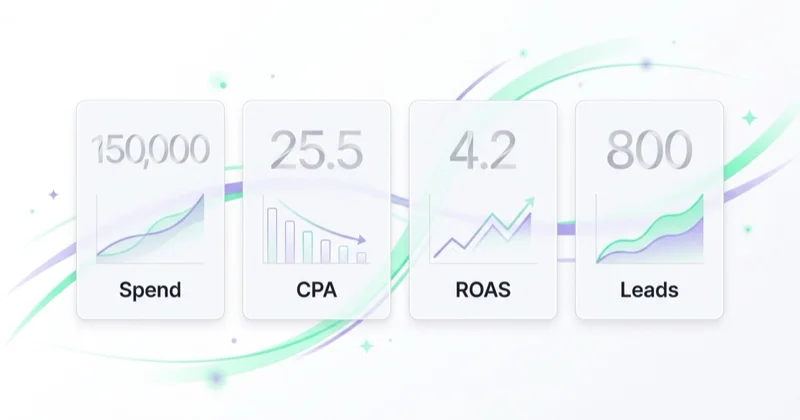
Paid media dashboard metrics should be split into business, channel and diagnostic layers.
Business layer
- total spend;
- total revenue or qualified pipeline;
- blended CPA or CAC;
- blended ROAS or MER;
- new customer share;
- lead quality;
- margin where available;
- payback period where available.
Channel layer
- Google Ads spend, conversions, revenue or qualified leads;
- Meta Ads spend, conversions, revenue or qualified leads;
- TikTok Ads spend, conversions, revenue or qualified leads;
- Microsoft Ads or LinkedIn where relevant;
- remarketing vs prospecting split;
- brand vs non-brand split for search;
- campaign type or objective.
Diagnostic layer
- CPC, CPM, CTR;
- conversion rate;
- frequency;
- impression share;
- search terms;
- placement or creative performance;
- product or category performance;
- conversion lag;
- disapproved ads or feed errors.
The diagnostic layer is not the headline. It helps explain the headline.
What to track for SEO and content
SEO should appear in the marketing dashboard because content affects acquisition and sales support.
Useful SEO sections:
- Google Search Console clicks, impressions, CTR and average position;
- top landing pages by organic sessions;
- organic conversions;
- branded vs non-branded trend;
- content clusters;
- AI Search referral traffic where available;
- pages that support sales objections;
- blog-to-service-page click paths;
- query trends for problem and commercial terms.
SEO should not be reduced to ranking screenshots. A growth team needs to know whether organic visibility is creating qualified demand, supporting paid media, answering buyer questions and improving brand recall. For AI-related visibility, the dashboard may also include prompt monitoring, citation notes and referral traffic from tools that pass source data.
What to track for CRM and sales
For lead generation, the CRM layer is where the dashboard becomes useful.
Important CRM metrics:
- raw leads;
- marketing qualified leads;
- sales accepted leads;
- booked meetings;
- show rate;
- opportunities;
- pipeline value;
- closed won;
- lost reasons;
- sales response time;
- source and campaign by CRM stage.
Without this layer, the dashboard can reward cheap form submissions that sales does not want. With this layer, the team can see whether Google, Meta, SEO or referrals are producing leads that become real opportunities.
For the lead-quality side, see B2B lead generation and lead nurturing.
Dashboard metrics by business model
| Business model | Dashboard focus |
|---|---|
| E-commerce | revenue, MER, ROAS, margin, new customers, repeat purchase, product/category performance |
| B2B services | qualified leads, sales accepted leads, opportunities, pipeline, sales cycle, source quality |
| SaaS | signups, activation, demo quality, CAC, payback, trial-to-paid, churn indicators |
| Local services | calls, booked jobs, quote requests, service area, response time, job value |
| Luxury brands | brand vs performance split, full-price sales, market contribution, premium creative signals |
| Agencies | client-level spend, blended outcomes, anomalies, commentary and next actions |
This is why a dashboard template should be flexible. The same layout cannot serve a fashion e-commerce brand, a SaaS product, a local lead-gen business and a B2B service company without changing the conversion model.
Dashboard views by role
A marketing dashboard should not force every user into the same level of detail. A founder, CMO, performance specialist and salesperson need different answers from the same data.
| Role | Primary questions | Best dashboard layer |
|---|---|---|
| Founder / CEO | Is growth efficient and predictable? | blended CAC, revenue, pipeline, payback, next actions |
| CMO / Head of Growth | Which channels and funnels need attention? | channel contribution, conversion quality, budget pacing |
| Performance specialist | What should be optimized in-platform? | campaign, creative, audience, query and placement diagnostics |
| Sales lead | Which sources create qualified opportunities? | lead stages, acceptance rate, meeting rate, lost reasons |
| Finance | Does spend map to margin and cash flow? | CAC, MER, margin, payback, forecast |
| Client stakeholder | What changed and what is being done next? | summary, anomalies, commentary, planned actions |
The same dashboard can serve several roles when it has layers. The top layer should be simple enough for a business decision. Deeper tabs can contain channel diagnostics, landing-page data, creative detail, SEO queries or CRM breakdowns. This prevents the executive view from becoming too technical and the specialist view from becoming too shallow.
For smaller teams, the first dashboard can be much simpler: spend, blended result, lead or revenue quality, top channel changes, tracking warnings and next actions. It is better to maintain a small trusted dashboard than a large view nobody uses.
Commentary and questions inside the dashboard
Numbers are not enough when a dashboard is used for management. A useful dashboard also needs interpretation: what changed, why it probably changed, what is uncertain and what the team will do next.
Useful commentary fields:
- what changed since the previous period;
- whether the change is material or noise;
- likely causes;
- tracking or data caveats;
- recommended action;
- owner;
- deadline;
- follow-up note after the action.
This is where dashboards move beyond static reporting. A growth team should be able to ask questions such as "why did blended CPA rise?", "which channel created qualified leads?", "what changed in non-brand search?", or "which product category is wasting spend?" The dashboard does not need to replace analysis, but it should make the first answer faster and the next action clearer.
Reconciliation: the dashboard problem most teams avoid
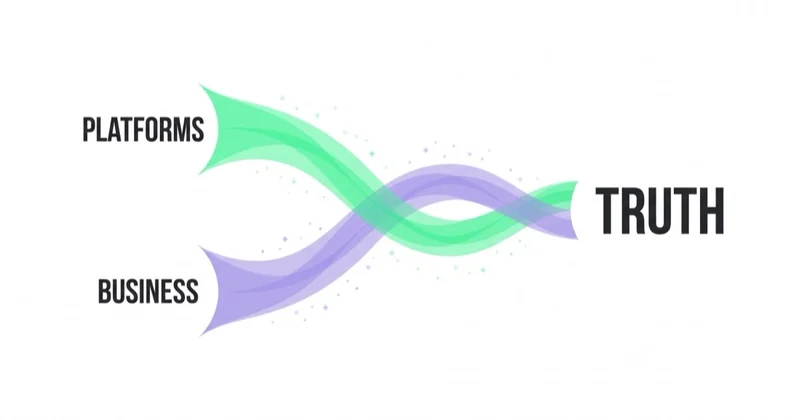
Google Ads, Meta Ads and TikTok Ads do not count conversions the same way. Each platform sees its own touchpoints and attribution windows. If the dashboard simply adds platform-reported conversions, it will often overstate performance.
A stronger dashboard separates:
- platform-attributed conversions;
- GA4 conversions;
- CRM or order-system outcomes;
- modeled or assisted contribution;
- business headline metrics.
This does not mean platform numbers are useless. They are useful for platform optimization. They are not always the best headline for the business. The dashboard should make that distinction visible.
API-connected dashboards
Manual exports create delay and errors. API-connected dashboards reduce the reporting burden by pulling data directly from advertising, analytics and business systems.
Typical data sources:
- Google Ads API;
- Meta Marketing API;
- TikTok Marketing API;
- GA4 Data API;
- Google Search Console API;
- CRM exports or API;
- order system or e-commerce platform;
- internal notes or annotations.
The important design choice is not just "connect everything." It is deciding which system is trusted for each metric. An ad platform may be trusted for spend. GA4 may be used for session behavior. CRM may be trusted for sales stages. Finance or order data may be trusted for revenue.
How Space Ads approaches this
At Space Ads, the dashboard is part of the operating system for client work. We use an internal workflow where advertising and analytics data can be pulled through Space Ads OS and then made available in client dashboards. At a high level, the system connects data from platforms such as Google Ads, Meta Ads, TikTok Ads and GA4, then presents it in a dashboard designed for decisions rather than exports.
The client-facing dashboard is not meant to expose every internal detail. It is meant to make the working rhythm clearer: spend, revenue or lead quality, channel contribution, campaign performance, anomalies and next actions. For more advanced clients, the dashboard can also support custom views, period comparisons, channel splits and report presentations. The value is that the client and agency look at the same numbers, which reduces time spent reconciling spreadsheets and increases time spent deciding what to do next.
Dashboard governance
A dashboard needs governance or it becomes untrusted.
Rules to define:
- who owns each metric;
- which source is authoritative;
- how often data refreshes;
- how attribution differences are labeled;
- how tracking issues are annotated;
- how historical changes are handled;
- who can edit dashboard logic;
- how client comments or explanations are added;
- what happens when data is missing.
The dashboard should show uncertainty when it exists. If Meta and GA4 disagree, the dashboard should not hide the difference. It should explain what each number means.
Common dashboard mistakes
| Mistake | Why it hurts | Better approach |
|---|---|---|
| Showing every metric | Creates noise | Build around decisions |
| Adding platform conversions together | Overstates performance | Reconcile against GA4, CRM or business data |
| No CRM layer for lead gen | Cheap leads look successful | Track sales acceptance and opportunity quality |
| No SEO data | Content impact is invisible | Add GSC and organic landing pages |
| No annotations | Changes look random | Mark launches, tracking issues and major tests |
| Same dashboard for every model | Metrics do not fit the business | Adapt by e-commerce, B2B, SaaS or service model |
| No next actions | Dashboard becomes passive | Add recommendations and ownership |
30-day marketing dashboard plan
Week 1: define the decision model
Choose the questions the dashboard must answer. Define business model, conversion goals, trusted data sources and headline metrics.
Week 2: connect the core data
Start with spend, revenue or lead outcomes, GA4 conversions, CRM stages and Search Console. Keep the first version focused.
Week 3: add diagnostic depth
Add campaign, creative, product, landing page, search query, funnel and anomaly sections. Label platform-attributed vs business-reported metrics clearly.
Week 4: create operating cadence
Define who reviews the dashboard daily, weekly and monthly. Add notes, next actions and ownership. Remove charts that do not support decisions.
FAQ
What is a marketing dashboard?
A marketing dashboard is a live view that connects marketing activity to business outcomes. It helps teams track spend, channel contribution, conversions, sales quality, revenue or pipeline and the actions needed next.
What should a marketing dashboard include?
A marketing dashboard should include spend and pacing, blended efficiency, channel contribution, conversion quality, funnel health, SEO visibility, CRM or sales outcomes, anomalies and next actions.
Should a dashboard use platform data or GA4?
It should use both, but for different jobs. Platform data helps optimize campaigns. GA4 and CRM help reconcile the business outcome. A good dashboard labels the source and does not treat every platform-reported conversion as the final truth.
How should a lead generation dashboard measure quality?
A lead generation dashboard should show raw leads, sales accepted leads, meetings, opportunities, pipeline value, closed won and rejection reasons. Cost per lead alone is not enough.
Should SEO be included in a marketing dashboard?
Yes. SEO affects acquisition, brand demand and sales support. Search Console data, organic landing pages, organic conversions and content paths should be visible alongside paid media and CRM outcomes.
How does Space Ads use dashboards with clients?
Space Ads uses dashboards to connect advertising and analytics data into a shared decision view. The goal is to reduce manual reporting, show the same numbers to the client and agency, and make budget, creative, tracking and funnel decisions clearer.
Key takeaways
A marketing dashboard should make growth easier to manage. It should connect ads, SEO, GA4, CRM and sales into a clear operating view. The strongest dashboards do not show more data. They show the right data with enough context to make a decision.
For agencies and growth teams, the dashboard becomes valuable when it reduces reporting work and improves the quality of decisions. That means trusted sources, clear definitions, useful comparisons and visible next actions.
Sources and further reading
- Google Analytics Help - About events
- Google Ads Help - About conversion measurement
- Google Ads Help - About offline conversion imports
- Google Search Central - Using Search Console and Google Analytics data for SEO
Continue learning
- Marketing Reporting in 2026: Cross-Channel Client Reports Across Google, Meta and TikTok
- Ad Management Software in 2026: From Dashboards to AI Workspace
- Google Analytics 4: Why Implement It and What Are the Benefits?
- B2B Lead Generation: How to Build a Predictable Pipeline From Paid Media and SEO
- Marketing audit · Google Ads · Meta Ads
Continue reading
Marketing Reporting in 2026: Cross-Channel Client Reports Across Google, Meta and TikTok
Better reporting is less about prettier charts and more about trustable decisions. This guide shows what to reconcile across Google, Meta, TikTok and GA4, how to answer client questions without weekly exports, and where plain-language reporting is replacing static dashboards.

Who Owns Your Google Ads, Meta, and GA4 When You Leave an Agency?
Your company should control its ad and analytics assets while the agency receives revocable access. This guide separates legal rights, platform roles, billing and infrastructure, then shows what to verify before an agency change.
What Good Marketing Agency Reporting Looks Like (and the Red Flags)
A useful agency report gives client and agency a shared, auditable view of goals, spend, outcomes, uncertainty and next decisions. This guide provides a practical structure, metric definitions and constructive red flags.


































