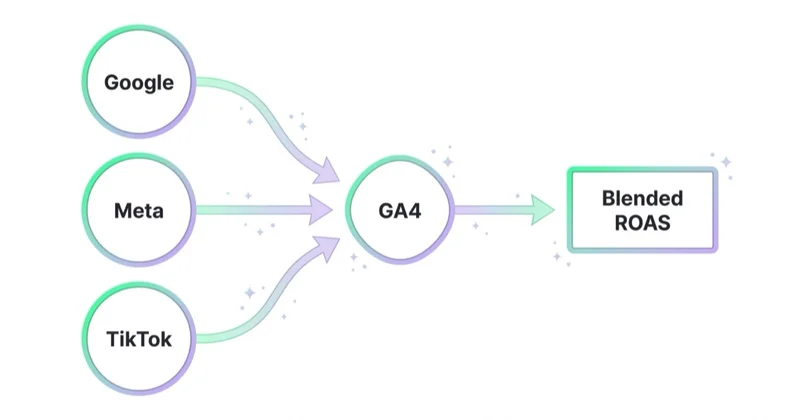
Marketing reporting is the work of turning raw advertising data into decisions and, for agencies, into answers a client can trust. In 2026 that almost always means cross-channel reporting: pulling Google Ads, Meta and TikTok into one view, reconciling it against GA4, and reducing it to a few numbers that actually change what you do next. The hard part is rarely access to data — every platform exports plenty. The hard part is making three platforms that count conversions differently tell one coherent story.

TL;DR
- Reporting is a decision tool, not a data dump. A report that doesn't change a budget, a bid or a creative decision is just a prettier export.
- Three platforms means three versions of the truth. Google, Meta and TikTok each claim conversions on their own attribution model. Add them up and you'll overcount. GA4 is the referee.
- Platform-reported and business-reported numbers diverge — by a lot. Reconciling against GA4 routinely shows a meaningful share of platform-claimed conversions that don't line up with the business. Reporting that ignores this overstates performance.
- A good report has a fixed spine. Spend and pacing, blended efficiency, channel contribution, creative signal, anomalies, and a short list of next actions — in that order.
- For agencies, the cost is the ritual. The weekly manual export into a slide deck is hours that should go to strategy, and it scales linearly with client count.
- Dashboards are moving to answers. The shift is from a static dashboard you read to reporting you can ask questions of in plain language.
- Cadence beats depth. A simple report seen daily beats a beautiful one seen quarterly. Decisions happen on the data you actually look at.
For the wider map of where reporting tools sit among ad management software, see our pillar guide to ad management software in 2026. This post goes deep on the reporting layer specifically.
A quick glossary
- Blended ROAS — revenue divided by total spend across all channels, measured against one reconciled revenue figure rather than three platform-reported ones.
- Attribution window — the period after an ad interaction in which a conversion is credited to it; each platform sets its own, which is why their totals differ.
- Reconciliation — comparing platform-reported conversions against a neutral source (GA4 or server-side data) to produce one consistent number.
- Last-click — an attribution model crediting the final touchpoint before conversion; simple, but it hides the contribution of earlier channels.
- MER (marketing efficiency ratio) — total revenue divided by total marketing spend; a blended, platform-agnostic health metric finance teams trust.
- Incrementality — the lift a channel actually caused, versus the conversions it merely claimed credit for.
Why cross-channel reporting is genuinely hard
It's tempting to blame the tools, but the difficulty is structural, and it's worth naming precisely.
Each platform measures what it can see. Google attributes conversions to Google touchpoints; Meta attributes to Meta touchpoints; TikTok to TikTok. A buyer who saw a TikTok video, later clicked a Meta ad, then searched your brand on Google can be claimed — in full — by all three. None of them is lying. They're each answering "did my ad contribute?" honestly, from inside their own window. Sum the three dashboards and you get a number larger than your actual sales.
This is why GA4 — or a server-side measurement layer — matters as a neutral reference. It sits outside any single platform and gives one consistent definition of a session, a conversion and a revenue value. The job of cross-channel reporting is to use that neutral layer to apportion credit sensibly, rather than to trust each platform's self-report at face value.
The goal isn't to catch platforms out. It's the opposite: to connect platform data to business numbers so that budget decisions hold up when someone in finance asks why spend went up. Reporting that does this well is what lets you scale spend with confidence instead of hope.
What a good marketing report actually contains
Strong reports share a spine. The order matters as much as the content — it moves from "what happened" to "what we'll do."
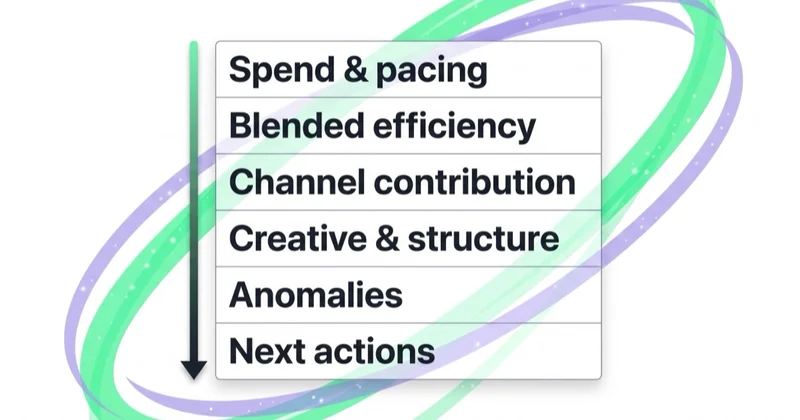
- Spend and pacing. Where the money went, against budget, with month-to-date pacing. The first thing any stakeholder wants to know is whether spend is on plan.
- Blended efficiency. Blended ROAS or CPA across all channels — not three separate platform-reported figures. This is the number that maps to the business, reconciled against GA4 and, ideally, actual revenue.
- Channel contribution. What each platform contributed to the blended result, with the honest caveat that attribution is apportioned, not absolute. This is where incrementality thinking earns its place — contribution is more useful than last-click credit.
- Creative and structure signal. Which angles and formats are working, fatigue indicators, and where the structure is helping or hurting. Numbers without creative context don't tell you what to change.
- Anomalies. What broke or spiked — a tracking gap, a disapproved ad, a feed error, a sudden CPM jump. The exceptions are usually where the money is.
- Next actions. Three to five decisions the report supports. If a section doesn't lead to an action, ask why it's in the report.
Everything else — device splits, geo breakdowns, audience detail — is supporting evidence that lives below the fold, available when a number above prompts a question.
| Report section | Question it answers | Headline metric |
|---|---|---|
| Spend and pacing | Are we on plan? | Spend vs budget, MTD pace |
| Blended efficiency | Is it profitable overall? | Blended ROAS / CPA / MER |
| Channel contribution | Where is it working? | Reconciled contribution per channel |
| Creative and structure | What should we change? | Top angles, fatigue indicators |
| Anomalies | What broke or spiked? | Exceptions vs prior period |
| Next actions | What do we do now? | 3–5 decisions |
Platform-reported vs business-reported: the gap nobody puts in the deck
Here's the observation that separates reporting that holds up from reporting that flatters: the numbers the platforms report and the numbers the business actually sees rarely match, and the gap is not small.
Across the 25+ client accounts we reconcile daily, comparing Meta-reported conversions against GA4 per country routinely shows attribution differences in the 15–52% range — the variance depending on market, tracking setup and consent rates. That's not a measurement failure to hide; it's information. It tells you which markets have a tracking problem, where consent is eroding signal, and how much to discount a platform's self-reported ROAS before you make a budget call on it. A report that quietly passes platform numbers through as truth will, sooner or later, justify a budget decision that the business numbers don't support.
The fix is procedural, not heroic: reconcile every reporting period against a neutral layer, show the blended number as the headline, and keep the platform-reported figures as a secondary line clearly labelled as platform-attributed. The client sees one truth and the optional detail behind it.
Dashboards, reports, and reporting you can ask questions of
These three are often confused. Briefly — the full category map is in the ad management software pillar, so here only the reporting-relevant distinction:
A dashboard is always-on and exploratory — you go look when you want to know something. Looker Studio is the common starting point. A report is periodic and narrative — it's built for a stakeholder at a cadence, and it argues a point. The newer mode is reporting you can query in plain language: instead of reading a fixed layout, you ask "why did blended ROAS drop last week?" and get the reconciled answer with the contributing factors. The difference is whether you navigate to the insight or request it.
Most teams need all three: a live dashboard for the team, a periodic report for stakeholders, and increasingly a way to interrogate the data without rebuilding a view by hand.
Client reporting for agencies: escaping the export ritual
For agencies, reporting is where margin quietly leaks. The pattern is familiar: every Friday, someone opens four panels per client, exports the numbers, drops them into a templated deck, writes the commentary, and sends it. Multiply by twenty clients and it's not a task — it's a part-time job that produces no strategic value.
Three things make agency reporting sustainable. First, a fixed template so commentary is the only manual part. Second, reconciliation built in, so you're not defending platform-reported numbers you don't believe. Third, a cadence the client actually reads — a live link beaten by a PDF nobody opens. The brands that get the most from their agency tend to be the ones looking at the same reconciled numbers their agency is, daily, not the ones receiving a quarterly slide deck.
The operational tell of a healthy agency reporting setup: the time per client per week trends toward the commentary, not the data assembly. If it doesn't, the tooling is wrong.
A 5-step cross-channel reporting setup
- Fix tracking first. Reporting on broken tracking just produces confident wrong numbers. Confirm conversion tags, server-side events and value tracking before anything else.
- Pick the neutral reference. Decide what reconciles the platforms — usually GA4, ideally backed by actual revenue. This is the source the headline number comes from.
- Define the spine. Lock the six sections above as a fixed template so every period looks the same and only the commentary changes.
- Set the cadence. A live link for the team, a periodic narrative for stakeholders. Decide who reads what, how often — and make the team-facing view daily.
- Automate the assembly, keep the judgement. Let tooling gather and reconcile the data; keep a human writing the "so what." The analysis is the value; the export is not.
How to choose a reporting setup
- Does it reconcile, or just re-display? A tool that unifies platform-reported numbers without a neutral reference will overstate performance. Reconciliation against GA4 is the difference between a report and a flattering export.
- Headline metric: blended or per-platform? The report should lead with the blended, business-mapped number. Per-platform figures are supporting detail, not the headline.
- Cadence and access. Live link the client can open beats a PDF. Daily-readable beats quarterly-beautiful.
- Commentary effort. How much manual work remains after the data assembles? For agencies this is the whole economics of the thing.
- Does it lead to action? Every section should support a decision. If it doesn't change anything, it's decoration.
Where Space Ads OS fits
The reporting problem is exactly what pushed us to build Space Ads OS the way we did. The Friday-deck ritual was eating hours that should have gone to clients, so reporting in the system runs from chat: you ask for the week's numbers and get a reconciled, cross-channel answer — Google, Meta, TikTok and GA4 already merged, blended efficiency as the headline, platform-attributed figures kept as the secondary line. A client-ready report is generated from live account data rather than rebuilt by hand.
The part that matters most isn't the format — it's that the numbers are reconciled by default, so the report argues from what landed in the business, not what the platforms claimed. That's the same discipline a good analyst applies manually, made fast enough to do daily across a portfolio. If weekly reporting is currently a tax on your team's time, it's worth a look.
Stop doing / do instead
| Stop doing | Do instead |
|---|---|
| Summing platform-reported conversions | Reconcile against GA4; report one blended number |
| Leading with per-platform ROAS | Lead with blended, business-mapped efficiency; platform figures are context |
| Producing reports with no next actions | End every report with 3–5 decisions it supports |
| Beautiful quarterly decks nobody opens | A simple live view read daily — frequency beats polish |
| Quietly passing platform numbers through | Show the reconciled number and the gap; trust survives a finance check |
| Rebuilding the same deck by hand each week | Automate assembly; spend the saved time on commentary |
FAQ
What is marketing reporting?
Marketing reporting is the process of collecting advertising and analytics data and turning it into a clear view of performance that supports decisions. In a paid media context it usually spans multiple platforms — Google Ads, Meta, TikTok — reconciled against an analytics layer like GA4, and reduced to the few metrics that map to business outcomes such as blended ROAS, CPA, revenue and pacing.
Why don't Google, Meta and TikTok reporting numbers match?
Each platform attributes conversions using its own model and window, and can only see its own touchpoints. A single sale that involved more than one platform can be claimed by each of them. Summing the dashboards therefore overstates total conversions. A neutral measurement layer such as GA4 is used to reconcile the figures and produce one consistent number.
What should a marketing report include?
A strong report has a fixed spine: spend and pacing against budget, blended efficiency (ROAS or CPA) reconciled against GA4, each channel's contribution, creative and structure signal, anomalies that broke or spiked, and a short list of next actions. Supporting detail like device, geo and audience splits sits below the headline numbers.
What is the best marketing reporting tool?
There's no single best tool — it depends on whether your main need is exploration (a live dashboard), stakeholder communication (a periodic report), or fast querying (reporting you can ask questions of). The more important criterion than the brand is whether the tool reconciles platform numbers against a neutral layer or simply re-displays platform-reported figures.
How often should marketing reports be produced?
For decisions, frequently — a simple report reviewed daily or weekly drives better choices than a detailed one seen quarterly, because decisions are made on the data people actually look at. For formal stakeholder updates, a monthly narrative report is common, ideally backed by a live link the stakeholder can open any time.
What is blended ROAS and why does it matter for reporting?
Blended ROAS is total revenue divided by total ad spend across all channels, measured against one reconciled revenue figure rather than each platform's self-reported return. It matters because per-platform ROAS double-counts shared conversions and flatters performance; the blended number maps to what the business actually earned, which is the figure a budget decision should rest on.
What's the best way to report Google, Meta and TikTok in one place?
Connect each platform's data, reconcile it against a neutral layer such as GA4, and present a blended headline with per-platform contribution as supporting detail. Whether you use a dashboard, a periodic report or a tool you can query in plain language, the non-negotiable is reconciliation — without it you're adding up three numbers that each claim the same sales.
In short
- Reporting is a decision tool: if a report doesn't change a budget, a bid or a creative call, it's a status update.
- Three platforms means three attribution models — summing their dashboards overstates results. GA4 is the neutral referee.
- Platform-reported and business numbers diverge meaningfully; show the reconciled figure and the gap rather than passing platform claims through.
- A good report has a fixed spine — pacing, blended efficiency, contribution, creative, anomalies, next actions — and ends in decisions.
- For agencies, the cost is the weekly export ritual; automate the assembly, keep the commentary human.
- Cadence beats polish: a simple report seen daily drives better decisions than a beautiful one seen quarterly.
Sources and further reading
- Google Analytics Help — About attribution and attribution modeling
- Google Analytics Help — Reporting overview
- Meta Business Help — About attribution settings
- Space Ads — Incrementality testing and geo experiments
- Space Ads — Ad management software in 2026
Continue learning
Continue reading

Marketing Dashboard: What Growth Teams Should Track Across Ads, SEO and Sales
A marketing dashboard should connect ad spend, SEO, GA4, CRM and sales outcomes into one decision view. This guide explains what growth teams should track and how to avoid dashboard noise.

What Good Marketing Agency Reporting Looks Like (and the Red Flags)
A useful agency report gives client and agency a shared, auditable view of goals, spend, outcomes, uncertainty and next decisions. This guide provides a practical structure, metric definitions and constructive red flags.

Who Owns Your Google Ads, Meta, and GA4 When You Leave an Agency?
Your company should control its ad and analytics assets while the agency receives revocable access. This guide separates legal rights, platform roles, billing and infrastructure, then shows what to verify before an agency change.