
A B2B marketing budget should help leadership decide how much growth the company can responsibly fund. That requires more than attaching a pipeline number to a channel plan. A credible budget connects spend to gross profit, customer acquisition cost, payback, cash timing and the capacity of sales and delivery teams. It also makes uncertainty visible instead of presenting one optimistic forecast as fact.
That is what it means for a budget to “survive the CFO”: not that every line is protected from cuts, but that finance and marketing can examine the same assumptions and make deliberate trade-offs. A strong model may support more investment, a staged release or a reduction. Its value is that the decision is auditable.
TL;DR
- Start with the part of the company target marketing is expected to support: new business, expansion, retention or a defined combination.
- Model gross profit and cash, not revenue alone. A deal can add revenue and still fail the company's payback or margin requirement.
- Use mature cohort data and show downside, base and upside cases. Funnel averages are assumptions, not guarantees.
- Report paid-media CAC and fully loaded CAC separately, with an agreed definition of which sales and marketing costs are included.
- Separate demand capture, demand creation, customer marketing, measurement and experimentation because they work on different time horizons.
- Release uncertain spend in stages, with decision dates and evidence thresholds appropriate to the sales cycle.
- Treat attribution as one input. “Influenced pipeline” is not proof that marketing caused the revenue.
Why finance challenges a B2B marketing budget
Marketing is vulnerable when its costs are visible immediately but its commercial effect arrives months later. A list such as “$200,000 for events, $300,000 for media and $80,000 for software” tells finance where cash will go, but not what assumptions justify the spend or when the company could reasonably expect evidence.
Budget pressure is not a failure of presentation alone. Cash runway, debt covenants, margin, strategic priorities and delivery capacity can all justify a cut even when marketing performs well. Current surveys provide useful context rather than a universal benchmark: Gartner reported that marketing budgets at the large companies in its 2026 sample averaged 7.8% of company revenue, while 56% of respondents said they lacked the budget required to deliver their strategy. The CMO Survey's 2026 breakout report found wide variation in how often executives cut marketing when profits disappoint. Neither result tells an individual company what it should spend.
The practical answer is a shared decision model. Finance validates cost, margin, cash and accounting definitions; marketing owns channel assumptions and evidence quality; sales owns acceptance, progression and capacity; operations confirms that new customers can be served profitably.
Start with the commercial scope, not last year's budget
Before working backwards from a target, define what marketing is accountable for. “Grow revenue by $5 million” is too broad if part of that growth must come from renewals, price increases or sales-led expansion. Agree on:
- the target period and target market;
- new-logo, expansion, retention and partner-sourced contributions;
- the stage at which marketing receives source credit;
- the revenue metric—bookings, annual contract value, ARR or recognized revenue;
- gross margin or contribution margin expected from the acquired business;
- the maximum acceptable acquisition cost and payback period; and
- the sales, onboarding and delivery capacity available.
Then work backwards through the funnel using historical cohorts that have had enough time to mature. A lead cohort from last month is not comparable with one that has completed a nine-month sales cycle. Segment the model where economics differ materially—for example by region, product, company size or new versus existing account—and use ranges when sample sizes are small.

This bottom-up logic complements, but should not be replaced by, a top-down benchmark such as a percentage of revenue. Industry averages can flag an unusual plan; they cannot account for your margins, category maturity, growth rate or go-to-market model.
Model gross profit, CAC and payback correctly
Pipeline is an intermediate indicator, not money in the bank. The budget must show whether the customers expected from that pipeline can repay their acquisition cost and contribute cash on an acceptable timeline.
Define at least two acquisition-cost views:
- Paid-media CAC: media spend divided by the customers assigned to that media under a documented attribution rule. It is useful for channel operations, but it is not the full cost of growth.
- Fully loaded CAC: the agreed acquisition costs—usually relevant media, marketing payroll and agency fees, acquisition software and an appropriate share of sales cost—divided by new customers. Finance should approve exactly what is included.
For a simple subscription model, CAC payback can be estimated as:
CAC payback in months = fully loaded CAC ÷ monthly gross profit from a new customer
If CAC is $24,000 and monthly revenue is $4,000 at a 75% gross margin, monthly gross profit is $3,000 and the simplified payback is eight months. The real cash profile may be longer or shorter once implementation cost, payment terms, churn, commissions, annual prepayment and working capital are included. Use the finance team's model for investment decisions; the simplified formula is a diagnostic, not an accounting standard.
Reverse the target through the funnel—but test feasibility
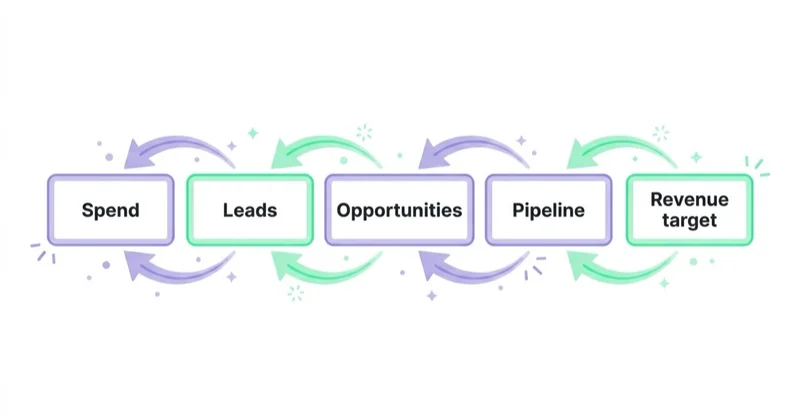
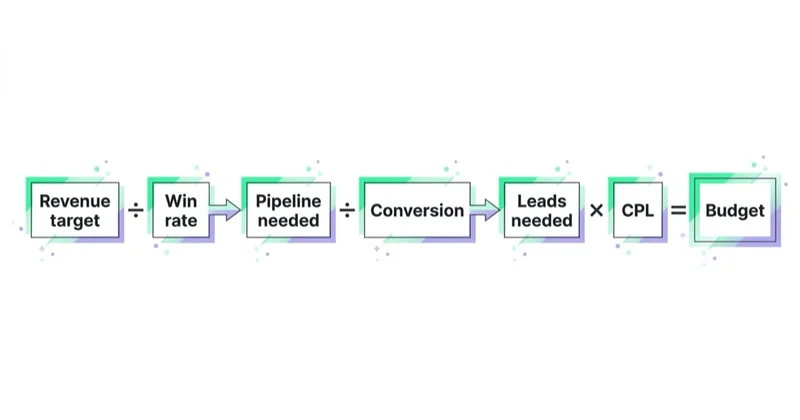
Suppose the agreed new-business target is $4 million of ARR and average new-logo ARR is $100,000. The mechanical model starts with 40 wins. At a 25% opportunity-to-win rate, it requires 160 qualified opportunities. If 40% of accepted sales leads become opportunities and 20% of qualified inquiries become accepted sales leads, it requires 2,000 qualified inquiries.
The arithmetic is easy. The management questions are harder:
- Are those conversion rates based on mature, comparable cohorts?
- Can the reachable market produce 2,000 genuinely qualified inquiries in the period?
- Can sales work 400 accepted leads and 160 opportunities without response times or win rates deteriorating?
- Can delivery onboard 40 customers at the expected margin?
- Does the expected contract duration justify the CAC and cash exposure?
- How much pipeline must be created before the target period because of the sales-cycle lag?
If the answers do not hold, increasing the lead target in a spreadsheet will not solve the plan. Leadership must change the timing, offer, market, sales capacity, price, conversion assumptions or revenue target.
Use at least three scenarios:
| Assumption | Downside | Base | Upside |
|---|---|---|---|
| Average new-logo value | Conservative observed value | Mature cohort median | Supported improvement |
| Stage conversion | Lower credible bound | Mature cohort rate | Tested improvement |
| Sales-cycle length | Longer | Typical | Shorter credible bound |
| Gross margin | Lower | Finance plan | Higher credible bound |
| Fully loaded CAC | Higher | Expected | Lower credible bound |
Populate the table with company data and show the resulting wins, gross profit, cash need and payback. Avoid silently combining the best assumption from every scenario.
Separate budget purpose from cost behavior
The familiar people, media, programs and tools categories show where money goes, but finance also needs to know how easily it can change. Tag each line by purpose and cost behavior.
| View | Useful categories | Decision it supports |
|---|---|---|
| Purpose | Demand capture, demand creation, customer marketing, measurement, experiments | What commercial job does the spend perform? |
| Resource | People, media, programs, data and tools | What is being purchased? |
| Cost behavior | Fixed, variable, committed, discretionary | How quickly can the company change it? |
| Cash timing | Monthly, prepaid, milestone, cancellable or non-cancellable | When does cash leave and what is recoverable? |
This prevents a nominal 10% cut from producing an unexpected 25% reduction in useful activity because contracts, payroll and prepaid events cannot move at the same speed. Record notice periods, minimum commitments and cancellation terms next to material lines.
Separate demand creation from demand capture
Demand capture reaches buyers already expressing intent, while demand creation aims to make the company more likely to be considered in future buying situations. Both can matter, but they have different evidence and time horizons. The distinction is explained in demand generation vs lead generation.
Do not protect every brand or content line simply by calling it “long term.” Ask what audience it reaches, what buying situation it addresses, whether the creative is recognizably yours and how the hypothesis will be evaluated. LinkedIn's B2B Institute research supports balancing long-term brand building with short-term activation, but its often-cited allocation is a population-level finding—not a mandatory ratio for every company.
Evidence for demand creation may include target-account reach, brand search, direct traffic, sales feedback and later pipeline progression. These signals can be informative without being causal. Where scale permits, use geographic, audience or time-based holdouts and lift studies. State what the design can and cannot prove.
Present pipeline without pretending it is revenue
Use one stage dictionary across marketing, sales and finance. A qualified inquiry, accepted sales lead, opportunity, sourced pipeline and closed-won booking must each have an owner and entry rule.
- Pipeline coverage is open qualified pipeline divided by the target for the same period. It is useful only when stage quality, close date and cohort are comparable.
- Weighted pipeline multiplies opportunities by assumed win probabilities. Those probabilities need calibration against actual outcomes.
- Sourced pipeline applies an agreed source rule. It is not necessarily incremental.
- Influenced pipeline shows that marketing touched an account or opportunity. It should never be presented as revenue caused by marketing.
Deduplicate account and opportunity values, separate new and expansion pipeline, and show ageing. Saying a budget “buys $10 million in pipeline” implies certainty the forecast does not have. Say instead that the plan is expected to produce a range under stated assumptions.
Use staged releases and a learning agenda
An annual budget does not need to be an unconditional annual commitment. Divide uncertain investment into releases with an owner, decision date and evidence gate. Early-stage tests may be judged on signal quality and leading indicators; mature programs can be judged on qualified pipeline, gross profit and payback.
A sensible test definition includes:
- the audience and commercial hypothesis;
- the minimum viable spend or sample needed to learn;
- the primary and guardrail metrics;
- the time required for the result to mature;
- scale, revise and stop criteria; and
- the next decision date.
Do not cancel a nine-month-sales-cycle experiment after four weeks because it lacks closed revenue. Equally, do not use a long sales cycle as permission to continue indefinitely without leading evidence.
Build the finance review pack
A budget is easier to govern when the model and assumptions travel together. The monthly or quarterly review pack should contain:
- actual spend, committed spend and forecast cash by category;
- target, forecast and actual outcomes by mature cohort;
- gross margin, paid-media CAC, fully loaded CAC and payback;
- pipeline by stage, source definition, age and expected close period;
- downside, base and upside forecast with variances explained;
- an assumptions register with source, owner and last validation date; and
- decisions required, including the expected consequence of delay or reduction.
This is also where marketing should disclose measurement limitations. Platform attribution, CRM source fields and multi-touch reports answer different questions. Reconciliation matters more than selecting the number that makes a program look strongest.
How Space Ads structures a CFO-ready budget
We structure the budget around an agreed commercial scope and work backwards through mature funnel cohorts. We separate paid-media efficiency from fully loaded acquisition economics, show gross-margin payback and place demand capture, demand creation, customer marketing, measurement and experiments on their proper time horizons.
The result is not a promise that every euro produces a fixed amount of pipeline. It is a decision model: assumptions, scenarios, cash commitments, evidence gates and ownership in one place. Paid channels such as LinkedIn Ads then earn investment through the role they play in that model rather than through isolated platform metrics. When no internal leader owns the cross-functional process, a fractional CMO can coordinate marketing, sales and finance—but the definitions still need executive agreement.
What to stop doing—and what to do instead
| Stop doing | Do instead |
|---|---|
| Starting with last year's budget plus a percentage | Start with commercial scope, unit economics and capacity |
| Treating pipeline as guaranteed revenue | Show stage quality, maturity and scenario ranges |
| Reporting one blended CAC | Separate paid-media and fully loaded CAC |
| Calculating payback on revenue | Use gross profit and model cash timing |
| Claiming all influenced pipeline | Publish source rules and attribution limits |
| Applying the same cut to every line | Rank spend by evidence, strategic role, reversibility and marginal return |
| Protecting all “brand” spend by default | Define the audience, hypothesis, evidence and review date |
| Releasing a full test budget without gates | Stage investment around a realistic learning agenda |
FAQ
How do you build a B2B marketing budget?
Define the part of the commercial target marketing supports, then model backwards from wins through mature funnel conversion ranges. Test the required volume against market, sales and delivery capacity. Add fully loaded acquisition costs, gross margin, cash timing and downside, base and upside scenarios before allocating spend to programs.
What should a CFO-ready marketing budget include?
It should include commercial scope, cost definitions, gross margin, paid and fully loaded CAC, payback, cash commitments, funnel assumptions, pipeline ageing, capacity constraints and scenario forecasts. Each important assumption needs an owner, source and review date.
What is a good CAC payback period for B2B?
There is no universal target. An acceptable period depends on gross margin, churn or renewal, contract length, growth strategy, cash availability and risk. Compare cohorts with similar products and markets, and have finance approve the payback definition before using it as a release gate.
How should marketing present pipeline to finance?
Use agreed stage definitions and show open, weighted, sourced and influenced pipeline separately. Include age, expected close period, historical stage conversion and attribution limits. Present a forecast range rather than claiming that spend guarantees a specific pipeline value.
How do you defend brand and demand-creation spend?
Define the audience, buying situation, creative hypothesis, expected time horizon and evidence plan. Use target-account reach, brand demand, sales evidence and pipeline progression carefully; add holdout or lift testing where feasible. Do not present assisted or influenced pipeline as causal proof.
What should be cut first when a B2B marketing budget falls?
There is no fixed channel order. Protect legal and customer commitments, measurement needed to make decisions and programs with validated marginal returns. Then assess each remaining line by evidence, strategic role, reversibility, cash commitment and opportunity cost. A broad percentage cut is rarely the most rational answer.
Key takeaways
- A CFO-ready budget is a shared decision model, not a rhetorical defence of marketing.
- Start with marketing's agreed commercial scope and model gross profit, cash and capacity—not revenue alone.
- Use mature cohorts, ranges and explicit assumptions instead of false precision.
- Separate paid-media CAC from fully loaded CAC and calculate payback on gross profit.
- Distinguish demand capture, demand creation, customer marketing, measurement and experiments.
- Treat pipeline and attribution as decision evidence, not guaranteed or causal revenue.
- Stage uncertain spend and document what would cause the company to scale, revise or stop.
Sources and further reading
- Gartner — 2026 CMO Spend Survey
- The CMO Survey — 2026 firm and industry breakout report
- LinkedIn B2B Institute — 5 Principles of Growth in B2B Marketing
Continue learning
- What percentage of revenue should you spend on marketing?
- Marketing ROI: how to model it so finance believes it
- Demand generation vs lead generation in B2B
- SaaS paid acquisition: Google and Meta for pipeline, CAC and payback
- LinkedIn Ads for B2B pipeline
- Fractional CMO: owning the budget conversation with finance
Continue reading
Marketing ROI: How to Model It So Finance Actually Believes It
A finance-ready marketing ROI model defines incremental contribution, fully loaded cost, time lag, counterfactual and uncertainty. This guide connects ROI with payback, MER and marginal return.
What % of Revenue Should You Spend on Marketing? Benchmarks by Stage and Industry
Marketing spend as a percentage of revenue is useful for comparison, but it cannot determine the right budget for one company. This guide combines current benchmarks with a model based on CAC, gross margin, payback, growth targets, and operating capacity.
Brand Strategy vs Performance: How Brand Work Actually Shows Up in Revenue
Brand building and sales activation serve different time horizons, but neither belongs to a single channel. Learn how to set objectives, use the 60/40 finding responsibly, connect brand indicators to commercial outcomes, and measure incremental impact.


































