
Marketing spend as a percentage of revenue varies with the cost definition, revenue denominator, business model, margin, stage and growth plan, so no “X% for every business” rule is defensible. Gartner reported an average of 7.8% of company revenue in its 2026 CMO survey; the Spring 2026 CMO Survey reported 9.0%. These are self-reported averages from different samples and definitions, not targets. A company-specific budget should combine strategic priorities and baseline capabilities with serviceable demand, marginal acquisition economics, contribution, cash timing and operating capacity.

TL;DR
- There is no universal correct percentage. Two current surveys report averages of 7.8% and 9.0% of revenue, but their respondents and definitions are not interchangeable.
- Define both numerator and denominator. State whether the budget includes payroll, media, technology, agencies, trade activity and tax, and whether revenue is actual, forecast, gross or net.
- Use both top-down and bottom-up views. Strategy and financial capacity set the envelope; marginal economics and operating constraints determine where additional budget can be released.
- Compare like with like. Stage, margin, sales motion, company size, geography, growth rate and cost classification can all change the ratio.
- Separate cost by job and time horizon. Baseline capability, demand capture, customer growth, brand, retention and experiments need different evidence and decision rules.
- Top-down percentages cause two failures: underfunding growth in a good market, and overspending against a shrinking one.
- Not every marketing cost has an attributable short-term return. Govern the portfolio with contribution and experiments where possible, plus milestones and risk controls where direct attribution is not appropriate.
Why the percentage is the wrong place to start
The question "what percentage of revenue should we spend on marketing?" feels precise, but it inverts the logic. It treats marketing spend as a fixed proportion to be set top-down, when spend should be derived from what the business is trying to achieve and what acquisition actually costs.
Consider two companies with identical revenue. One has a CAC payback of four months and a large addressable market; every additional euro of marketing returns quickly and there is room to grow. The other has a payback of two years and a saturated market; extra spend returns slowly, if at all. A single "12% of revenue" rule would badly underfund the first and dangerously overspend the second. The right budget is different because the economics are different — and the percentage each ends up at is a result of those economics, not a rule either followed.
Bottom-up modelling asks how much qualified demand is available, how acquisition cost changes with spend, when contribution arrives and how much volume the business can fulfil. Top-down planning asks what the strategy requires, what cash and profit constraints apply and how the portfolio should balance current demand with future capability. Reconcile the two, then express the result as a percentage. If the ratio differs sharply from a relevant benchmark, investigate the definitions and assumptions rather than automatically moving the budget toward the average.

What current 2026 marketing budget benchmarks say
Current benchmarks require context before they can support a decision:
- Gartner CMO Spend Survey 2026: 7.8% of company revenue. The survey covered 401 CMOs and other marketing leaders in North America, the United Kingdom and Europe. Gartner says the vast majority represented companies with annual revenue above $1 billion, making it mainly a large-enterprise reference.
- The CMO Survey, Spring 2026: 9.0% of company revenue and 9.6% of total company budget. Duke University's long-running survey, supported by Deloitte and the American Marketing Association, reports the average across its respondent mix.
The difference between 7.8% and 9.0% does not make either result wrong. Company size, respondent mix, survey timing, denominator and the definition of “marketing” can change the average. Neither figure is a prescription for a seed-stage software company, regional professional-services firm or direct-to-consumer brand.
The directional factors remain useful:
| Factor | Why it can raise the ratio | Why it can lower the ratio |
|---|---|---|
| Revenue base | Investment is large relative to current revenue | Revenue base is large relative to current investment |
| Growth plan | New markets, products or customer segments require capability and demand creation | Plan prioritises current customers or cash generation |
| Sales motion | More acquisition cost is classified inside marketing | More cost sits in sales, partners or distribution |
| Margin and cash timing | Contribution and liquidity can support a larger envelope | Thin contribution or long payback constrains spend |
| Accounting and taxonomy | Payroll, software, media and production are included | Some go-to-market costs sit in other functions |
Two companies in the same industry can legitimately report very different ratios. Before comparing them, normalise the numerator, denominator, revenue maturity, sales motion and growth plan. A lower marketing ratio is not automatically more efficient; it may reflect a larger revenue base, underinvestment or acquisition costs classified elsewhere.
Define what counts as marketing spend
A benchmark is meaningless when the numerator is inconsistent. A board-ready budget needs a stable cost taxonomy. It will usually include:
- paid media, sponsorships, and marketplace promotion;
- marketing-team compensation and employer costs;
- agencies, contractors, and specialist advisors;
- creative, video, content, and landing-page production;
- software, data, analytics, and marketing automation;
- events, sales collateral, PR, research, and brand tracking;
- discounts or promotions only when the company consistently classifies them as marketing.
Sales compensation, cost of goods sold, customer onboarding and trade discounts may be shown separately, but the policy must match finance's classifications and remain stable. A low marketing-to-revenue ratio can simply mean that acquisition cost sits in account executives, partners, retail distribution or customer success. Leadership should therefore review both marketing spend / revenue and an agreed total go-to-market spend / revenue, with a bridge between them.
For international groups, currency translation and tax treatment also need a written rule. US budgets may be presented net of sales tax because it is generally collected at the transaction level, while UK and EU entities need a consistent treatment of recoverable VAT. The point is comparability, not one universal accounting presentation.

Stage and growth plan change the denominator
An early-stage company can show a high ratio partly because current revenue is small while it builds a team, systems, category awareness and a pipeline for future periods. A mature company may show a lower ratio because established revenue is a larger denominator. That arithmetic does not prove that the first company is investing correctly or that the second is efficient.
Compare stage together with gross margin, runway, retention, serviceable demand and the timing of revenue. For pre-revenue or low-revenue firms, percentage of revenue may be unstable or meaningless; absolute cash burn, milestone delivery and runway can be more useful controls. For mature firms, a steady ratio can still hide declining reach, rising media prices or deferred capability investment.
Classify spend by the job it performs
A two-way “growth versus maintenance” split is often too coarse. A practical portfolio may include:
- Baseline capability — essential team, measurement, website, CRM, governance and production capacity.
- Demand capture — activity serving existing intent, assessed on marginal contribution and demand coverage.
- Customer and market growth — acquisition, expansion and market-entry programmes with explicit assumptions and payback ranges.
- Brand and future demand — activity evaluated with reach quality, brand measures and suitable experiments rather than forced into last-click ROAS.
- Learning portfolio — bounded tests with a hypothesis, maximum exposure and decision date.
This classification makes trade-offs visible. Some baseline costs are step-fixed rather than proportional to revenue; demand capture can saturate; brand effects can span periods; and experiments may be valuable even when they do not produce immediate sales. This complements how to plan a marketing budget and the definitions behind customer acquisition cost and payback.
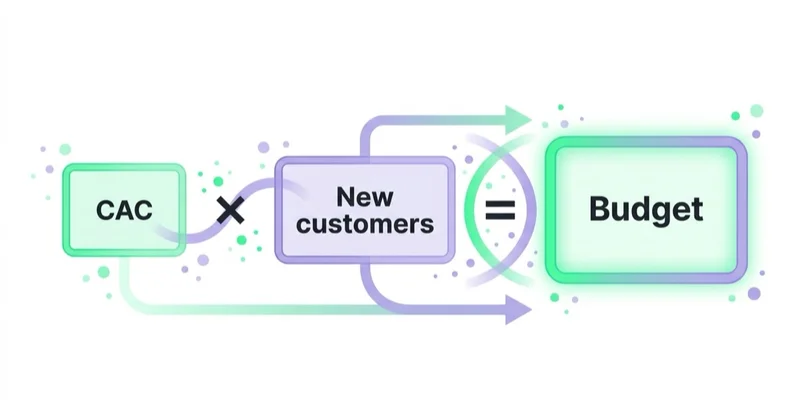
Build the budget from unit economics
A practical bottom-up model has five steps:
- Set the target for new customers or qualified opportunities. Account for retention and churn so gross additions do not masquerade as net growth.
- Estimate marginal, fully loaded acquisition cost by segment and channel. Include media, creative, tools, agency cost and an agreed share of payroll; show how cost may change at higher spend.
- Test contribution margin and payback. Revenue does not repay CAC; customer contribution does.
- Add baseline capability, brand, retention and learning. Not every necessary cost can or should be assigned to an individual acquisition.
- Apply operating and cash constraints. Marketing should not create more orders or opportunities than sales, inventory, onboarding, or support can absorb.
For example, a target of 300 new customers at an estimated fully loaded CAC of $1,500 creates a planning case of $450,000, not a guarantee that 300 customers are available at a constant price. Add $300,000 for agreed baseline, brand and learning activity and the initial envelope is $750,000. Against $10 million in planned revenue, that is 7.5%. Now stress-test acquisition volume, marginal CAC, contribution, revenue timing and the downside case before comparing 7.5% with a relevant survey.
Set rules for releasing and reducing budget
A strong platform ROAS is not enough to release more budget. Four conditions should hold: customer quality remains stable, marginal payback is acceptable, the business has delivery capacity, and serviceable demand remains. Every test also needs a predefined stop-loss, maximum exposure, and review date.
Budget should contract when marginal CAC moves beyond the approved threshold, customer quality deteriorates, or operations cannot absorb demand. A temporary attribution lag should not be treated as structural deterioration. Decision windows need to reflect the sales cycle, conversion delay, and refund or cancellation behavior.
This turns the annual budget into governed investment tranches. Finance retains downside control, while marketing can scale without waiting for the next planning cycle whenever the agreed evidence is present.
Glossary
- Marketing-to-revenue ratio — total marketing spend as a percentage of revenue.
- Bottom-up budgeting — deriving spend from growth targets, CAC and payback rather than a top-down percentage.
- Baseline capability — minimum people, systems, measurement and production capacity required to operate the plan.
- Marginal CAC — the acquisition cost expected for the next increment of customers or spend, not the historical average.
- CAC payback — months for a customer's gross-margin revenue to repay acquisition cost.
- Serviceable demand — the portion of potential demand the company can realistically reach, convert and fulfil within the planning period.
The two ways a top-down percentage fails
Setting the budget as a fixed percentage of revenue creates two predictable failures, in opposite directions.
Underfunding a validated opportunity. When marginal contribution and payback remain acceptable, a rigid annual cap can prevent the business from testing or capturing additional demand. More budget is justified only while customer quality, fulfilment capacity and causal evidence remain credible.
Overspending against a shrinking one. When revenue falls, a percentage-of-revenue budget falls with it — often exactly when the business most needs to defend its position, and sometimes cutting the growth spend that would recover it. Conversely, a percentage that does not flex can keep spending into a market where returns have collapsed.
Both failures come from treating the percentage as the decision. The decision is how much to invest given the return available; the percentage is what that investment happens to equal this year.
How Space Ads approaches the marketing budget
We start by agreeing the cost taxonomy, revenue denominator and strategic jobs the portfolio must perform. Platform spend, production, agency cost and CRM outcomes are reconciled before new and returning customers are separated. Acquisition scenarios use marginal cost, contribution and payback; baseline capability, brand and learning remain visible as distinct lines with suitable evidence. We also test sales capacity, inventory, onboarding, service delivery and the cash needed to finance the plan. Benchmarks are applied after the model produces a range. Pre-agreed thresholds govern when a tranche can increase, pause or return for review. This connects web analytics, performance marketing and fractional CMO leadership to whole-company economics.
Stop doing / Do instead
| Stop doing | Do instead |
|---|---|
| Copying an industry percentage as the target | Reconcile strategy and cash constraints with bottom-up economics |
| Comparing ratios with different definitions | Normalise numerator, denominator, stage, model and period |
| Blending every marketing job in one number | Show baseline, capture, growth, brand and learning separately |
| Capping spend despite validated marginal returns | Release controlled tranches while quality, capacity and payback hold |
| Cutting all marketing when revenue dips | Protect the spend that defends and recovers position |
| Treating marketing as a fixed cost to minimise | Treat it as an investment judged on return |
FAQ
What percentage of revenue should a company spend on marketing?
There is no universal figure. Gartner reported 7.8% for its 2026 respondent base, while the Spring 2026 CMO Survey reported 9.0%; neither is a recommended range. Define what counts as marketing, model the strategic requirements and marginal economics, apply cash and capacity constraints, then use a comparable benchmark only as a reasonableness check.
Is a marketing budget an input or an output?
The final ratio is an output, but the budget requires both directions. Strategy, cash and profit constraints set a top-down envelope; bottom-up models estimate baseline capability, available demand, marginal acquisition economics and capacity. Reconcile the two and show scenarios rather than pretend one formula determines the answer.
Why do B2C companies spend more of revenue on marketing than B2B?
They do not always. Some consumer models classify media and promotion inside marketing, while sales-led B2B models place more acquisition cost in sales compensation or partners. Company size, margin, growth plan and cost taxonomy also matter. Compare total go-to-market economics as well as the marketing ratio.
How does company stage affect the marketing budget?
Early companies often show a higher ratio because current revenue is a small denominator while capabilities and demand are built ahead of revenue. Mature companies may have a larger installed revenue base. Stage is important, but so are margin, runway, sales motion, growth plan and classification; it does not prove whether the budget is right.
Should you cut the marketing budget when revenue falls?
Not automatically. Reforecast demand, contribution, cash and capacity, then review each budget line by job, evidence and reversibility. Some activity may need to contract, while measurement, customer communication or profitable demand generation may warrant protection. Use downside and recovery scenarios rather than one automatic percentage.
How do you benchmark a marketing budget correctly?
First align the numerator and denominator, then match company size, geography, model, stage, period and growth plan as closely as the source permits. Review the sample and whether figures are averages or medians. Use Gartner and The CMO Survey as directional references for their respondent populations, not as a target or a universal range.
Key takeaways
- No universal percentage exists; Gartner reported 7.8% for 2026 and The CMO Survey reported 9.0% for Spring 2026, using different samples and definitions.
- Define the cost numerator and revenue denominator before comparing ratios.
- Reconcile a top-down strategic and financial envelope with bottom-up marginal economics and capacity.
- Separate baseline capability, demand capture, customer growth, brand and learning because their evidence and time horizons differ.
- Use a benchmark as a diagnostic prompt, never as proof that a company is over- or under-spending.
Sources and further reading
- Gartner — 2026 CMO Spend Survey: marketing budgets at 7.8% of revenue
- The CMO Survey — Spring 2026 results
- The CMO Survey — 2026 Highlights and Insights Report
Continue learning
- How to plan a marketing budget for effective digital marketing
- Customer acquisition cost benchmarks by industry
- The marketing dashboard growth teams should track across ads, SEO and sales
- SaaS paid acquisition: Google and Meta for pipeline, CAC and payback
- Fractional CMO: ownership of the budget-and-strategy question
Continue reading

Marketing ROI: How to Model It So Finance Actually Believes It
A finance-ready marketing ROI model defines incremental contribution, fully loaded cost, time lag, counterfactual and uncertainty. This guide connects ROI with payback, MER and marginal return.

How to Build a B2B Marketing Budget That Survives the CFO
A CFO-ready B2B marketing budget connects spend to gross profit, customer economics, cash timing and credible pipeline scenarios. This guide shows how to build that model without hiding uncertainty behind attribution or false precision.

MER vs ROAS: The Blended Metric Your Board Should Actually Track
MER is a useful whole-business efficiency control; platform ROAS is an attribution-based operating signal. Learn to define both, avoid additive errors and connect them with contribution and incrementality.


































