
A CEO needs a concise decision view of marketing, supported by the ability to inspect operational detail when risk or performance changes. The executive question is not “did the platform hit ROAS?” It is whether the company acquired valuable demand, converted it into recognized or realized revenue, retained enough contribution after variable and acquisition costs, and can finance the next period of growth.

This is a management view aligned with the P&L and cash plan, not a replacement for statutory accounting. Finance should own the definitions of revenue, cost, contribution and period cutoffs; marketing, sales and product should explain the drivers. Without those shared definitions, even a beautiful dashboard invites the wrong decision.
TL;DR
- Use one executive page with drill-downs. Show outcomes, unit economics, cash exposure, forecast variance and the decision required.
- Agree on definitions before targets. Revenue, contribution, “new customer,” acquisition cost and pipeline stage need owners and written rules.
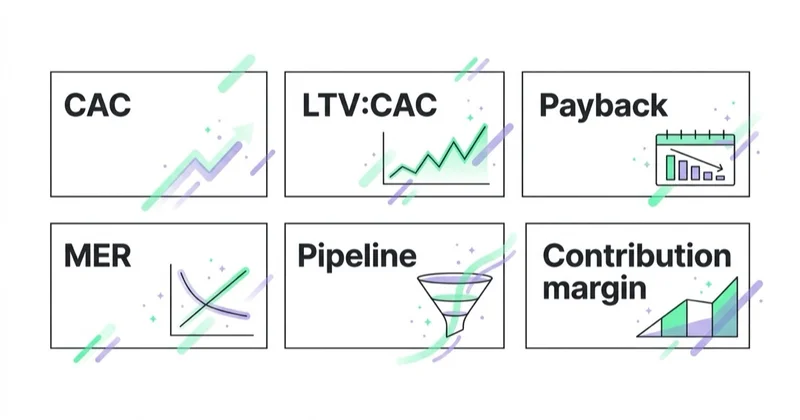
- The core view usually includes new-customer revenue, contribution after marketing, fully loaded CAC, cohort payback, B2B pipeline quality and cash requirement.
- MER is a blended diagnostic, not causal ROI. It can move because of repeat buyers, price, seasonality, distribution, promotions or a changed denominator.
- Average return does not answer the next-budget question. Marginal return and operational capacity matter when deciding whether to add spend.
- Leading indicators are not automatically vanity. Qualified reach, search demand or MQLs may be useful when connected to a hypothesis and downstream outcome.
- Read cohorts and variance, not isolated totals. Separate new from returning demand and actual from plan, while respecting lag and seasonality.
Build a marketing view that reconciles with the business
An ad platform reports attributed conversions according to its own settings. Analytics reports observable journeys. The CRM reports pipeline. The commerce or billing system reports orders and collections. Finance determines recognized revenue and cost. The executive view should reconcile those layers rather than select the most flattering one.
Start with a bridge the CFO can audit:
- Demand and orders: leads, opportunities, orders or contracts created in the period.
- Realized outcome: recognized or collected revenue, with cancellations, returns, discounts and bad debt handled consistently.
- Variable economics: cost of goods, payment, fulfillment, commissions, onboarding and other costs that change with the customer or order.
- Acquisition investment: media, agency or team, creative, tools, promotions and any other cost included in the agreed CAC definition.
- Contribution and cash: what remains, when it arrives and how much working capital growth consumes.
The CEO should not run bids or diagnose daily creative fatigue. They should, however, understand material exceptions, concentration risks, measurement changes and assumptions behind the capital-allocation recommendation.
The executive marketing scorecard
| Number | What it tells the CEO | Main caveat |
|---|---|---|
| New-customer revenue or realized value | How much outcome came from customers acquired in the defined period | “New” and revenue timing must be consistent |
| Contribution after marketing | What remains after refunds, variable delivery cost and marketing investment | Not identical to statutory operating profit |
| Fully loaded CAC | Acquisition investment per genuinely new customer | Scope and cohort denominator can change the answer materially |
| Cohort CAC payback | How long cumulative cohort contribution takes to repay CAC | Early retention and margin are estimates |
| Incremental or marginal return | What marketing caused, and the expected return from additional spend | Requires experiments or a model with assumptions and uncertainty |
| Pipeline quality and coverage (B2B) | Whether qualified, timely pipeline can support the target | Coverage alone ignores conversion, age and deal quality |
| Cash requirement and forecast variance | Whether growth can be funded and whether actuals match the plan | Profitability can coexist with a liquidity problem |
No universal threshold makes these numbers healthy. A company with annual prepayment can support a different payback profile from a low-margin retailer or a services business that carries delivery payroll before collection. Show target, actual, prior comparable period and forecast, then add a short explanation of the driver and proposed decision.
Calculate CAC and payback without hiding assumptions
Use at least two CAC views:
Media CAC = paid media spend ÷ new customers attributed under the operating definition
Fully loaded CAC = agreed acquisition costs ÷ new customers acquired in the same cohort
Media CAC helps channel teams operate. Fully loaded CAC helps leadership understand economics. The numerator may include acquisition payroll, agency fees, creative production, discounts, tools and sales cost, depending on the business question. State what is included every time.

Payback should use cumulative cohort contribution rather than a single average month when revenue or margin changes over time:
CAC payback month = first month when cumulative contribution from the acquisition cohort equals or exceeds its CAC
For subscription or repeat-purchase businesses, show retention and contribution by acquisition cohort. For B2B, distinguish contracted value, recognized revenue, collected cash and contribution. Do not turn an optimistic LTV estimate into current-period profit.
MER is useful—but it is not “un-gameable”
MER is commonly calculated as:
MER = total revenue ÷ total marketing spend
It is useful because it reconciles two business totals and avoids adding platform-attributed revenue together. It is not a causal measure of what marketing produced. Revenue may include returning customers, organic demand, sales effort, price increases, retail distribution and effects of past investment. The ratio can also improve when spend is cut faster than revenue falls, even if the company is weakening future demand.
Keep MER alongside ROAS, but label the revenue, spend scope and time basis. Diagnose movements through new-customer mix, price, volume, margin, retention and incrementality evidence.
What the CEO should not read without context
Operational metrics can be useful, but they should not be presented as the business outcome:
- Reach, impressions and attention need a defined audience, frequency and expected downstream effect. They matter for some brand investments but do not equal revenue.
- Platform ROAS is an operating attribution view. Never sum claimed revenue across platforms and call the result company revenue or incremental sales.
- Weekly channel movement matters only when it is outside expected variation, affects the forecast or reveals a material risk.
- Lead and MQL volume needs qualification, acceptance, conversion, age and value. A changed scoring rule can move the count without changing demand.
- Average order value or contract value needs margin and mix. Higher revenue can come with lower contribution.
The principle is not “ignore the metric.” It is “know what decision the metric supports.” The executive page should surface a diagnostic only when it explains an outcome, changes the forecast or requires cross-functional action.
Read comparable trends, cohorts and marginal return
A monthly result may be meaningful or noisy depending on volume, sales cycle, seasonality and data maturity. Compare rolling periods and the same seasonal window, but also preserve cohort views so a growing business does not hide weaker new customers inside an expanding total.
The decision to add budget depends on marginal return: the expected outcome from the next unit of spend at the current level. Historical average ROI can remain attractive while the next increment performs poorly. Response curves and marginal ROI estimates can support this decision, but they are models with uncertainty. Google's Meridian documentation, for example, warns about lag, extrapolation and assumptions such as historical cost per media unit.
Before scaling, review:
- credible range for incremental contribution and marginal ROI;
- cash draw and payback under downside conditions;
- inventory, sales, onboarding and service capacity;
- concentration in one platform, product, market or customer segment;
- evidence from experiments and whether the result generalizes;
- what happens to forecast and learning if the extra budget is not approved.
Benchmarks can frame a question, but the marketing budget decision belongs to the company's response curve, strategy and cash constraint.
Glossary
- Management P&L view — an internal bridge from demand and acquisition cost to realized revenue, contribution and cash; it does not replace statutory reporting.
- MER — total revenue divided by the defined marketing spend; a blended efficiency ratio, not causal ROI.
- Fully loaded CAC — defined acquisition costs divided by genuinely new customers in the matched cohort.
- CAC payback — time until cumulative customer-cohort contribution repays acquisition cost.
- Contribution after marketing — realized revenue less defined variable costs and marketing investment.
- Pipeline coverage — pipeline value relative to a target, interpreted with stage, conversion, age and timing.
- Marginal ROI — estimated incremental outcome from a small additional unit of spend divided by that extra spend.
The questions a CEO should ask
When a number moves, the useful response is a question, not a demand for more of everything.
- Contribution below plan? “Is the variance price, volume, mix, retention, delivery cost or acquisition efficiency?”
- CAC climbing? “Did cost increase, did the new-customer denominator fall, or did its definition change?”
- Payback lengthening? “Which cohort, margin or retention assumption changed, and can cash fund the downside case?”
- MER moving? “How much came from new versus returning customers, and what evidence suggests causality?”
- Pipeline below plan? “Is the gap creation, qualification, conversion, aging, sales capacity or deal size?”
- Spend increase proposed? “What is the expected marginal contribution, credible range, stop condition and operational constraint?”
Each answer should separate fact, interpretation, decision, owner and next evidence date. That prevents a performance narrative from quietly replacing a forecast or an accountable action.
A monthly executive review format
A useful review has one executive page and accessible drill-downs. The summary shows actual versus plan for realized revenue, contribution, new customers or qualified pipeline, acquisition investment and cash. The next layer explains cohort CAC, payback, retention and marginal-return evidence. The decision box states what to increase, hold or stop, maximum exposure, threshold and owner.
Every material metric needs a definition, source, owner, plan variance, comparable prior period and relevant cohort. Restate historical comparisons when definitions or tracking change, or show the break explicitly. Year-over-year growth alone is insufficient when price, currency, product mix, acquisitions or margins changed.
The board also needs a cash view. Positive modeled LTV:CAC can coexist with a liquidity problem when media is paid now, inventory and delivery precede collection, or customer contribution arrives slowly. Show the downside case and connect the marketing plan to sales capacity, inventory, onboarding, service delivery and working capital.
How Space Ads approaches CEO-level reporting
In our reporting work, the recurring problem is a missing bridge between platform activity and business economics: dashboards show attributed conversions, while finance sees revenue, costs and cash on a different basis. Leadership then debates whose number is “right” instead of resolving definitions and decisions.
We build a one-page executive view that reconciles to agreed systems and keeps the operational drill-down underneath it. MER is labeled as blended; CAC is shown with its cost scope; payback is cohort-based; pipeline includes stage and age; recommendations include marginal return, uncertainty, cash and capacity. That reporting backbone supports web analytics and performance marketing. Cross-functional ownership of the plan may sit with a fractional CMO when the organization lacks that role internally.
Stop doing / Do instead
| Stop doing | Do instead |
|---|---|
| Using the platform dashboard as the business ledger | Reconcile platform, CRM, commerce and finance views |
| Treating MER as incremental ROI | Use it as a blended diagnostic with new/returning and mix context |
| Reporting one CAC without a cost definition | Show media and fully loaded CAC with matched cohorts |
| Reacting to an isolated period | Compare plan, seasonality, lag and cohort maturity |
| Hiding channel risks because they are “operational” | Escalate material exceptions and cross-functional constraints |
| Demanding “better numbers” across the board | Ask which driver changed and what decision follows |
| Scaling on average ROAS | Estimate marginal contribution, cash exposure and capacity |
FAQ
What marketing numbers should a CEO look at?
The exact set depends on the model, but it usually includes new-customer realized value, contribution after marketing, fully loaded CAC, cohort payback, cash requirement and forecast variance. B2B adds qualified pipeline by stage, age and expected timing. Show marginal-return evidence for budget changes.
How should a CEO read marketing as a P&L?
Reconcile demand and acquisition investment to recognized or realized revenue, defined variable costs, contribution and cash timing. This internal management view should use finance-approved definitions and sit alongside—not replace—the company's formal P&L.
What marketing metrics should a CEO ignore?
No metric should be ignored categorically. Reach, platform ROAS and MQLs can diagnose a specific job, but they should not be mistaken for company revenue or contribution. The CEO needs operational detail when it explains a material variance, risk, dependency or decision.
What is MER and why should a CEO care?
MER is total revenue divided by the defined marketing spend. It is a useful blended efficiency diagnostic and avoids summing platform claims, but it is not causal and can be moved by retention, price, seasonality, channel mix and denominator choices. Read it with new-customer, margin and incrementality evidence.
How does a CEO know if marketing spend should increase?
Estimate the incremental contribution and marginal return of additional spend, then test whether cash, inventory, sales, onboarding and delivery can support it. Historical MER or average ROAS is not enough. Use credible ranges, experiments or a suitable response model and define a stop condition.
What questions should a CEO ask the marketing team?
Ask what changed in price, volume, mix, retention, delivery cost, acquisition cost or measurement; whether the evidence is attributed or incremental; what the cash downside is; and what decision, owner, threshold and review date follow. The aim is an auditable decision, not a more persuasive narrative.
Key takeaways
- A CEO needs a one-page decision view with traceable drill-downs, not a platform scorecard.
- Reconcile demand, realized revenue, variable costs, acquisition investment, contribution and cash.
- Define new customer, CAC, payback and pipeline stages before setting targets.
- MER is a blended diagnostic; it is neither ungameable nor proof of incremental return.
- Scale against expected marginal contribution, uncertainty and operating capacity—not average ROAS alone.
- Every review should end with a decision, owner, exposure limit and next evidence date.
Sources and further reading
- The CMO Survey — 2026 executive report
- Google Meridian — Incremental outcome, ROI, and marginal ROI
- Google Meridian — Scenario planning and future budget optimization
Continue learning
- MER vs ROAS: the blended metric your board should track
- The marketing KPIs that matter (and the vanity metrics that don't)
- Customer acquisition cost benchmarks by industry
- Marketing ROI: how to model it so finance believes it
- Web analytics that ties spend to revenue
- Fractional CMO: marketing reported in numbers a CEO can act on
Continue reading

MER vs ROAS: The Blended Metric Your Board Should Actually Track
MER is a useful whole-business efficiency control; platform ROAS is an attribution-based operating signal. Learn to define both, avoid additive errors and connect them with contribution and incrementality.

Customer Acquisition Cost Benchmarks by Industry (and What a 'Good' CAC Really Is)
There is no universal 'good' customer acquisition cost. CAC only means something next to gross margin, lifetime value and payback period — and against your own model, not a benchmark. This guide explains how to calculate it correctly and how to read industry numbers without being misled.

Marketing ROI: How to Model It So Finance Actually Believes It
A finance-ready marketing ROI model defines incremental contribution, fully loaded cost, time lag, counterfactual and uncertainty. This guide connects ROI with payback, MER and marginal return.


































