
MER (marketing efficiency ratio) is usually calculated as total revenue divided by a defined pool of marketing spend. It gives leadership a useful whole-business efficiency trend without assigning every order to a channel. Platform ROAS answers a different question using each platform's attribution rules, and the same order can appear in more than one platform. MER is therefore a valuable control, but not a causal estimate of marketing impact and not immune to manipulation: revenue, returns, taxes, cost scope and reporting period must be defined consistently.
TL;DR
- MER = defined total revenue ÷ defined marketing spend. Document whether revenue is gross or net of returns, and whether the denominator includes only media or fully loaded marketing cost.
- Do not add platform ROAS values or platform-attributed revenue. Attribution can overlap, windows differ, and ratios are not additive.
- Use ROAS as an operational platform signal; use MER as a whole-business control. Neither proves incrementality by itself.
- “Blended ROAS” is not a standardised term. Some teams use it as a synonym for revenue divided by ad spend; others use attributed revenue. State the formula every time.
- A "good" ROAS depends on margin, not a universal target — a 3× ROAS can be a loss or a healthy profit depending on gross margin.
- MER belongs in a board scorecard, beside contribution margin, new-customer CAC, payback, retention and cash—not as the only marketing metric.
- Watch MER as a trend, especially against spend changes, to see if scaling is still efficient.
Why platform ROAS overstates return
ROAS—return on ad spend—is conversion value attributed to ads divided by ad spend under a stated model and window. Inside a platform, it can help compare campaigns that use compatible conversion definitions. The problem appears when leadership treats different platform reports as additive: a customer may interact with Meta, Google and email before buying, and the systems do not share one exclusive allocation rule.
Platform reports can overlap and use different click, view and modelling rules. They can also miss effects they cannot observe. In either direction, adding ROAS values is mathematically invalid: a 5× Google ROAS plus a 4× Meta ROAS is not a 9× business return. If a cross-channel ratio is required, first define a non-overlapping numerator and common denominator.
This is not solved by installing one more tag. Attribution models allocate observed credit; they do not recreate the counterfactual outcome in which the ad did not run. Platform ROAS can support channel operations, but business investment decisions need backend economics and, for material choices, experiments or credible causal models.

MER: the whole-business truth check
MER sidesteps channel allocation by dividing business revenue for a period by a defined marketing-cost pool for that period. The numerator should normally reconcile to finance, with cancellations, discounts, returns, tax and currency treatment stated. The denominator may mean media spend or fully loaded marketing spend; both can be useful, but they are different ratios and should not share one unlabeled name.
| Metric | What it divides | Best for | Weakness |
|---|---|---|---|
| Platform ROAS | Platform-attributed value ÷ platform spend | Operating within a platform | Model- and window-dependent; not causal |
| Blended ROAS | State the chosen numerator ÷ total ad spend | A cross-channel control | Term and numerator are not standardised |
| MER | Reconciled business revenue ÷ defined marketing spend | Whole-business efficiency trend | Confounded by non-marketing factors and cost scope |
MER's strength is also its limit. It is easy to reconcile and trend, but it does not show that marketing caused the revenue or which channel to adjust. The board can use MER to spot changes that require explanation. The operating team then combines channel diagnostics, contribution economics and incrementality evidence to decide what to change.
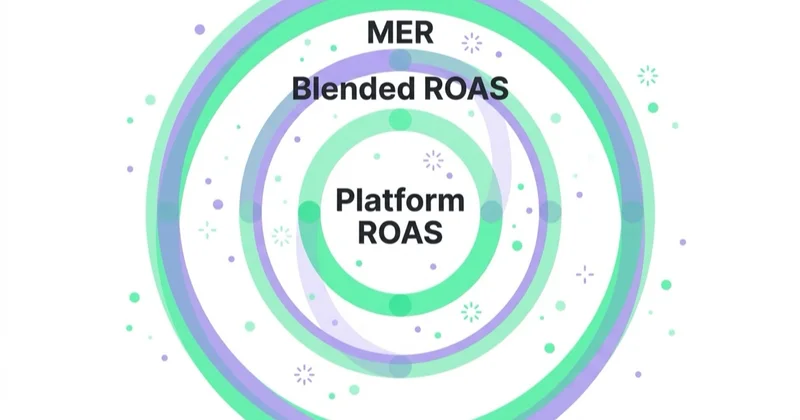
MER, blended ROAS and platform ROAS — how they fit
These are not competitors; they are a stack for different questions.
- Platform ROAS describes attributed value per unit of spend under that platform's settings. Use it as one channel diagnostic.
- Blended ROAS should answer the question encoded in its disclosed formula; do not assume every company calculates it the same way.
- MER describes how business revenue and the chosen marketing-cost pool moved together. It is a control, not proof of return.
A healthy reporting setup labels formulas, windows and sources and does not let one metric masquerade as another. Leadership should never receive summed platform ROAS. A useful marketing dashboard can show finance-reconciled MER and contribution beside new-customer economics, while keeping platform ROAS in the operational detail.
What is a "good" ROAS or MER?
There is no universal good ROAS. A simplified pre-overhead break-even can be calculated as one divided by contribution margin rate. For example, at a 25% contribution margin before advertising, the simplified break-even is 4×. But gross margin is not always contribution margin: payment fees, fulfilment, returns, discounts, sales commissions and variable support may also change with the order. Include the costs that actually vary before setting the target.
The same logic applies to MER, with an extra complication: its numerator includes revenue from new and returning customers and from demand not caused by current-period marketing. Set a target from the operating plan, contribution and cash needs rather than an external benchmark. Where reliable profit data and sufficient signal are available, margin-based conversion values can align bidding more closely with economics than uniform revenue values.
Glossary
- ROAS — revenue attributed to ad spend divided by that spend, within a channel.
- MER (marketing efficiency ratio) — total revenue divided by total marketing spend, at the business level.
- Blended ROAS — a non-standard term; define whether the numerator is backend revenue or deduplicated attributed revenue and whether spend means media only.
- Break-even ROAS — a modelled threshold at which attributed contribution covers ad spend under stated cost and attribution assumptions.
- Attribution overlap — multiple channels claiming credit for the same conversion.
- Contribution margin — revenue minus variable costs, the money available after fulfilling the sale.
How to actually use MER
MER is most useful as a trend watched against spend changes, not as a single monthly figure.
- Track MER over time, not in isolation — the direction matters more than the level.
- Watch MER as spend changes. A stable ratio is encouraging, but price, seasonality, stock, organic demand and customer mix may explain it. A falling ratio is a diagnostic, not proof of diminishing media returns.
- Pair MER with new-customer metrics. A stable MER driven entirely by repeat revenue can hide weak new acquisition — read it alongside CAC and new-customer share.
- Use it to challenge platform narratives. If platform ROAS rises while MER and contribution stay flat, investigate attribution, customer mix, returns, channel shifts and timing. The pattern does not by itself prove what would have happened without ads; that is a prompt for incrementality testing.
Reading MER is the measurement half; improving it — getting more revenue from the same spend — is a separate discipline of cutting waste, reallocating to what pays and lifting conversion rate, covered in how to get more from your existing ad budget.
MER can mislead too
MER is a whole-business control, not a causal estimate of advertising impact. Organic demand, pricing, seasonality, promotions, availability, and sales-team activity can improve the ratio without media becoming more effective. MER can also decline during a deliberate new-customer investment that pays back later.
Board reporting should therefore place MER beside net revenue after returns, contribution margin, new versus returning customers, fully loaded marketing cost, CAC, and payback under a stable cost definition. In B2B, probability-weighted pipeline can be a leading indicator, but it must never be added to closed revenue as though both were realized outcomes.
Scaling also needs a marginal MER view: the additional revenue or contribution generated by the next spend tranche. Historical MER describes the average mix; the marginal view tests whether more budget still creates value. Experiments or an MMM response curve provide a stronger basis than simply extending the average ratio.
How Space Ads approaches MER and ROAS
Our reporting review begins by reconciling revenue to finance and mapping every metric's numerator, denominator, attribution window and cost scope. We reject summed ROAS because ratios are not additive and platform conversion values can overlap.
We use finance-reconciled MER as a board-level control, contribution and customer economics for profitability, and platform ROAS as an operating signal. Targets come from the cost model and cash plan, not a generic benchmark. Material budget decisions use experiments or marginal-response modelling where feasible. That measurement discipline is the core of web analytics and performance marketing; a fractional CMO can own the definitions and decision cadence when no internal leader does.
Stop doing / Do instead
| Stop doing | Do instead |
|---|---|
| Summing platform ROAS as company performance | Use MER for the whole-business view |
| Presenting platform ROAS as business return | Lead with reconciled revenue, contribution, MER, CAC and payback |
| Chasing a universal “good ROAS” | Model the target from contribution, attribution and cash assumptions |
| Reading MER as a single monthly figure | Track MER as a trend against spend changes |
| Assuming ROAS/MER disagreement identifies the cause | Reconcile data, then run incrementality tests where material |
| Bidding to raw revenue | Bid to margin-based conversion value |
FAQ
What is MER in marketing?
MER is business revenue divided by a defined marketing-cost pool for the same period. It avoids allocating orders to individual channels, which makes it useful for reconciliation and trend analysis. It is not causal or ungameable: document net versus gross revenue, returns, taxes, currency, cost scope and time lag.
What is the difference between MER and ROAS?
ROAS divides platform-attributed conversion value by ad spend under a stated model and window. MER divides finance-reconciled revenue by a defined marketing-cost pool. Do not add ROAS values across platforms; calculate any blended ratio from a common numerator and denominator.
Why does platform ROAS overstate return?
It can overstate incremental return when multiple platforms claim the same order, include view-through or modelled conversions, or receive credit for demand that would have converted anyway. It can also miss effects it cannot observe. Platform attribution allocates credit; it does not measure the counterfactual by itself.
What is a good ROAS?
There is no universal target. A simplified break-even is one divided by contribution margin rate before advertising, but the model must include returns, discounts, fulfilment, payment fees, variable sales or support costs and the chosen attribution assumption. Cash timing and new-versus-returning mix can require a higher target.
Should the board look at ROAS or MER?
The board should see MER as one control beside net revenue, contribution, new-customer CAC, payback, retention and cash. Platform ROAS can appear as operational context, with its model and window stated. No single ratio proves that marketing caused the result.
What is blended ROAS?
The term is not standardised. Some teams mean total backend revenue divided by ad spend, making it close to ad-spend MER. Others use deduplicated attributed revenue. Always show the formula, revenue source, spend scope and attribution rules instead of relying on the label.
Key takeaways
- MER is reconciled business revenue divided by a clearly defined marketing-cost pool.
- Platform attribution can overlap, and ROAS ratios must never be added together.
- Use ROAS as an operational signal and MER as a whole-business control; neither is causal by itself.
- Set targets from contribution, cash, customer mix and attribution assumptions, not a universal benchmark.
- Track MER with spend, contribution, CAC, payback and experiments to interpret change.
Sources and further reading
- Google Ads Help — About Target ROAS bidding
- Google Meridian — ROI, marginal ROI, and response curves
Continue learning
- Customer acquisition cost benchmarks by industry
- The marketing dashboard growth teams should track across ads, SEO and sales
- Incrementality testing: geo experiments across Meta and Google
- Margin-based conversion values in Google Ads
- Web analytics that ties spend to revenue
- Fractional CMO: board-level marketing numbers you can trust
Continue reading

How a CEO Should Read the Marketing Numbers: A P&L View of Growth
A CEO needs a one-page decision view of marketing—not a platform scorecard. This guide connects revenue, contribution, CAC, cohort payback, pipeline, cash and marginal return while showing where blended ratios such as MER can mislead.

Marketing ROI: How to Model It So Finance Actually Believes It
A finance-ready marketing ROI model defines incremental contribution, fully loaded cost, time lag, counterfactual and uncertainty. This guide connects ROI with payback, MER and marginal return.

How to Choose a Performance Marketing Agency
Choose a performance marketing agency with a defined brief, evidence-based scorecard and clear commercial safeguards. This guide covers team evaluation, measurement, account access, fees, contracts and handover.


































