Customer acquisition cost (CAC) is a management metric: the acquisition cost assigned to a defined group of new customers divided by the number of customers in that group. It is simple only after finance, marketing and sales agree on the numerator, customer definition and time match. CAC is not a standardized accounting measure, and companies can calculate it differently.
There is no universal “good” CAC and no defensible industry table that can replace unit economics. A $500 CAC could be sustainable for one offer and destructive for another with the same selling price. The decision depends on contribution margin, retention, cash timing, servicing cost, risk and the return the company requires.
TL;DR
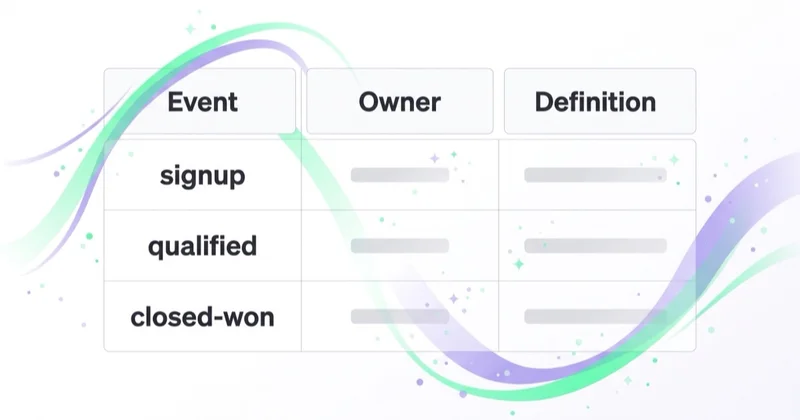
CAC requires a data contract. Define the cost pool, new customer, cohort, attribution or allocation method, currency and observation window.
Report several views without calling one “the truth.” Media-only, channel-attributed, blended and fully loaded CAC answer different questions.
Match cost to the customer cohort it was intended to create. Same-month division is misleading when the sales cycle or repeat behavior is longer.
Use realized contribution and payback before a forecast LTV ratio. LTV depends on assumptions about retention, margin and discounting.
Benchmarks are comparable only when definitions and business models match. A median from another sample is not a target.
Average CAC is not marginal CAC. The next budget increment can cost materially more than the historical mix.
Platform CPA is not CAC. A form, order or other attributed action is not necessarily a new, incremental customer.
How to calculate CAC (and the three versions that cause arguments)
The base formula is:
CAC = acquisition cost assigned to a customer cohort ÷ new customers in that cohort
The calculation starts with purpose. A bidding team, a channel owner and finance do not need the same cost view.
Version
What's included
Question it answers
Media-only CAC
Media spend ÷ new customers attributed under a stated rule
What acquisition cost does platform or attribution reporting assign to media?
Channel CAC
Direct channel costs ÷ customers assigned to that channel
How does a defined channel cohort compare under one method?
Blended CAC
Agreed acquisition spend ÷ all new customers
What did the total acquisition system cost per new customer on average?
Fully loaded CAC
Allocated acquisition payroll, media, agencies, commissions, creative, tools and other agreed costs ÷ new customers
What cost did the company allocate to winning the cohort?
None is automatically “the honest number.” Organic customers are not free: content, brand, referrals, product and sales effort may have created that demand. Fully loaded CAC also requires judgment. Teams must decide how to allocate shared brand work, management, software, sales development, founder time, customer marketing and commissions. Report the definition next to the value.
A second error is timing mismatch—dividing this month's spend by customers who close this month even though acquisition began months earlier. For considered purchases, assign cost to acquisition or opportunity cohorts using an agreed method and show cohort maturity. Also report a period view for cash management, but do not confuse it with cohort efficiency.
A third error is customer identity. Define new customer at the person, household, account, legal entity or billing level. Exclude tests, employees, duplicates, fraud, cancelled orders and reactivations according to a documented rule. Separate new-logo acquisition from expansion and retention; each has its own numerator and business question.
What a “good” CAC actually is: an affordable investment under uncertainty
CAC becomes useful beside the contribution the cohort has produced, how quickly cash returns and how uncertain the remaining value is.
Realized contribution after CAC. Revenue collected minus variable costs, service costs included in the company's definition and acquisition cost. This shows what has happened, not what a lifetime forecast promises.
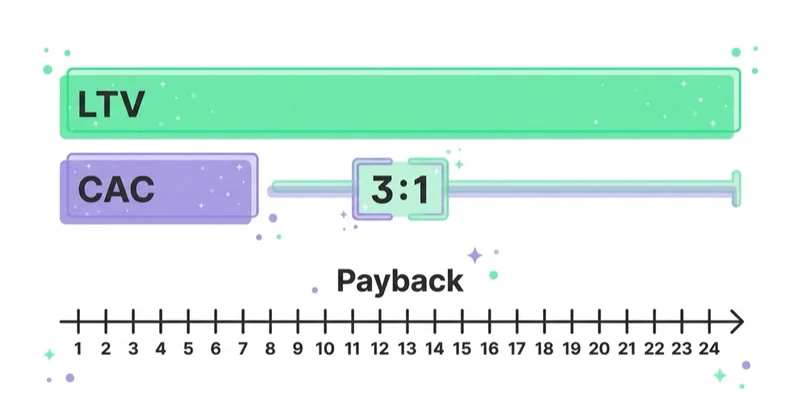
CAC payback. The time until cumulative cohort contribution repays acquisition cost. A simple subscription approximation is fully loaded CAC divided by monthly gross profit per new customer, but an actual cohort curve is better when churn, implementation, discounts or usage vary.
Forecast customer value. Expected future contribution, adjusted for retention, expansion, refunds, service cost, uncertainty and—where finance requires it—the time value of money.
Cash exposure. The gap between acquisition outflow and customer cash inflow, including payment terms, annual prepayment, inventory, implementation and working capital.
Use contribution or gross profit consistent with the decision, not revenue LTV. A customer who generates $1,000 of revenue at a 20% gross margin produces $200 of gross profit before acquisition and other costs—not $1,000 available to fund growth.
The familiar 3:1 LTV:CAC ratio and 12-month SaaS payback appear frequently in investor and operator material, but they are not accounting standards or cross-industry laws. Even cloud benchmarks segment payback expectations by go-to-market model. A high ratio does not by itself prove underinvestment: forecast LTV may be overstated, the addressable market may be small or marginal acquisition may already be uneconomic.
Set a maximum affordable CAC from downside, base and upside cohort economics plus the company's cash and return requirements. Finance should approve the margin, allocation, forecast horizon and discounting. Leadership should decide how much uncertainty and payback exposure it is prepared to fund.
Why "CAC benchmarks by industry" mislead
The search for a benchmark table is understandable. The problem is comparability, not the existence of data. The same headline CAC can mean different things because a benchmark may hide:
New logo, reactivation or expansion. These are different commercial motions and should not share a denominator.
Margin. A 70%-margin software business and a 25%-margin retailer can afford wildly different CACs at the same price point.
Channel mix. A brand with strong organic and word-of-mouth shows a low blended CAC that says nothing about the marginal cost of the next paid customer.
Maturity and brand. An established brand acquires more cheaply than a new entrant in the identical category, so a benchmark blends incumbents with challengers.
Definition drift. Two companies may include different payroll, commissions, brand, partner or software costs.
Sample and survivorship. A voluntary survey can overrepresent larger, healthier or more measurement-mature businesses.
Geography and period. Wages, media prices, interest rates, competition and channel conditions change across markets and time.
Statistic. Mean, median and quartiles answer different questions, especially with a skewed distribution.
Before using an external benchmark, require the report year, sample, geography, company size, business model, customer segment, cost definition, customer definition, maturity, currency and distribution—not just one number. Compare your metric using the same definition, then treat a gap as a question to investigate, not proof that the business is good or bad.
Public company filings demonstrate the problem. Different issuers define CAC or payback using their own allocations and non-GAAP gross-profit measures. Those disclosures can be valid for tracking that company while remaining unsuitable for direct comparison with yours. A benchmark without its data dictionary is not decision-grade.
How different business models read CAC
Rather than a false-precision number table, the honest breakdown is how each model should think about CAC.
Model
How CAC must be recovered
Watch out for
Ecommerce, low AOV, one-off
From first-order contribution unless repeat behavior is demonstrated
Revenue ROAS, returns, discounts and fulfillment cost
Ecommerce, repeat / subscription
Across observed acquisition cohorts and reorder curves
Forecast repeat that does not materialize
B2B SaaS
Through cohort gross profit or contribution over time
Cheap leads, unallocated sales cost and immature retention
High-ticket services
From realized project or account contribution
Small samples, founder sales time and delivery capacity
Transactional marketplace
By buyer and supplier side, then through completed transactions
Counting signups while liquidity and subsidies remain weak
A longer relationship can support more upfront CAC only when retention and contribution are credible and cash can fund the delay. High contract value alone is not permission to spend more: implementation, support, concentration and churn may absorb it.
Glossary
CAC — total acquisition cost divided by new customers won in a period.
Blended CAC — the agreed acquisition cost pool divided by all eligible new customers.
Media-only CAC — media spend divided by new customers attributed under a stated rule.
Fully loaded CAC — agreed direct and allocated acquisition costs divided by new customers.
LTV — forecast lifetime value under a stated margin, retention, horizon and discounting method.
LTV:CAC — forecast customer value divided by CAC; sensitive to both definitions.
CAC payback — time for cumulative cohort contribution to repay acquisition cost.
Contribution margin — revenue minus variable costs, the money actually available to fund CAC.
Marginal CAC — incremental acquisition cost divided by incremental customers as spend changes.
Platform CPA is not customer acquisition cost
CPA is the cost of an action defined in an ad platform: a purchase, form, registration or another attributed event. CAC is the company-level cost allocated to acquiring a new customer. The two match only if the action is a valid new customer, attribution and deduplication are correct, and the numerator includes the intended acquisition cost. That is unusual.
Suppose a campaign spends $40,000 and reports 400 forms, a $100 CPA. The CRM later records 80 qualified opportunities and 20 new customers. Media-only CAC under that attribution rule is $2,000. If the agreed allocation adds $10,000 of creative, tooling and team cost, fully loaded CAC is $2,500. The $100 form CPA is useful for funnel diagnosis, not as customer economics.
Ad platforms report attributed conversions under their own windows and models. They can claim customers who would have purchased anyway or be credited alongside another platform. Reconcile identities and outcomes with the CRM, order and finance systems, then use incrementality experiments where feasible. Attribution helps allocate and optimize; it is not causal proof.
Build a CAC data contract
Every decision-grade CAC report should state:
the question and metric version;
the cost period and customer cohort;
included costs—media, payroll, agencies, creative, tools, commissions and allocations;
the new-customer and deduplication rule;
treatment of refunds, cancellations, fraud, reactivations and expansion;
contribution-margin definition;
observation horizon and realized versus forecast value;
allocation or attribution method and known limitations; and
currency, tax and foreign-exchange convention.
For international groups, apply a consistent currency basis to cohort cost and value. For a long sales cycle, show cohort maturity so an immature quarter is not compared with a fully developed one. Freeze definitions for trend reporting; when a definition changes, restate history where practical or mark the break.
Segment only where economics and decisions differ materially: market, customer type, first product or plan, sales motion and acquisition cohort are common examples. Too much segmentation creates unstable small samples. Show counts and uncertainty next to the average.
Average CAC, marginal CAC and incrementality
Average CAC describes the historical mix. The budget decision concerns marginal CAC: the incremental cost of the next customers as spend changes. Early brand demand and high-intent search may be cheaper than the next audience or market, so average efficiency can remain attractive after the marginal investment has become uneconomic.
Estimate a response curve by spend range and mature cohort rather than extrapolating one average. Where possible, use geographic, audience or time-based holdouts to estimate customers caused by the investment. An incremental CAC denominator contains incremental customers, which may be smaller than platform-attributed customers.
When CAC is too high—or appears to be
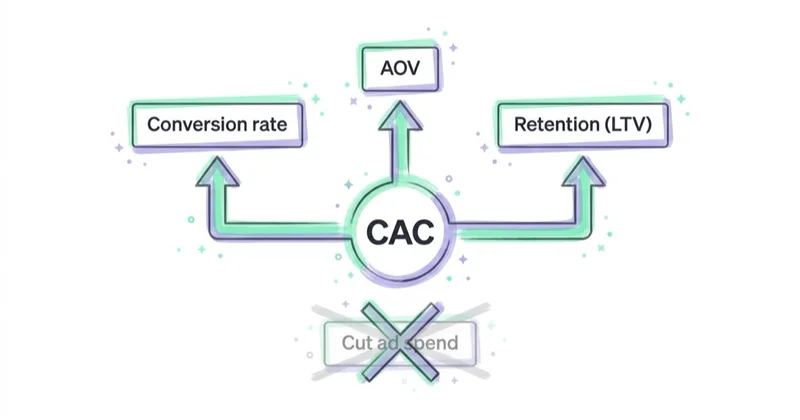
First verify the definition, cohort maturity and source data. Then identify the constraint. Reducing spend can be correct when marginal acquisition no longer meets the approved return; it is not the only lever.
Retention and customer value. Better retention can increase affordable CAC, but do not spend against forecast improvement before cohorts confirm it.
Margin and pricing. More contribution margin per customer directly funds more acquisition.
Targeting, offer and channel. Better fit may improve conversion and retention; broader scale may raise marginal CAC.
Sales and operations. Response, capacity, onboarding and service cost can turn acquired demand into lost or unprofitable customers.
Measurement. Attribution, duplicate identities or timing can make CAC appear better or worse. Use incrementality testing where feasible.
How Space Ads approaches CAC
We start CAC work with definitions, not a channel benchmark. Marketing, finance and sales agree which cost pool, customer, cohort, margin and time horizon answer each decision. Paid, blended and fully loaded views remain separate rather than being forced into one supposedly universal number.
Then the CRM or order system is reconciled with cost and finance data. Cohort contribution, payback, average and marginal CAC sit beside counts and forecast assumptions in the marketing dashboard leadership actually reads. Only then are bids, audiences, creative and pages judged against customer economics rather than a form CPA. The deeper B2B application is covered in SaaS paid acquisition; a fractional CMO can coordinate ownership when no internal leader holds the model.
Stop doing / Do instead
Stop doing
Do instead
Quoting one CAC without saying which version
Publish the numerator, denominator, cohort and allocation
Judging CAC in isolation
Read realized contribution, payback, cash exposure and forecast value
Using revenue LTV in LTV:CAC
Use an agreed contribution or gross-profit basis with forecast assumptions
Chasing an industry benchmark number
Validate comparability and set limits from your own economics
Blending expansion and new-logo
Separate them so the cost of real growth is visible
Scaling from historical average CAC
Model marginal CAC and incremental customers
FAQ
What is a good customer acquisition cost?
There is no universal good CAC. A sustainable limit comes from expected cohort contribution, payback, cash exposure, uncertainty and the company's required return. External ratios or payback ranges can be comparison points only when definitions and business models match.
How do you calculate CAC?
Divide an agreed acquisition cost assigned to a cohort by eligible new customers in that cohort. State whether the numerator is media-only, channel, blended or fully loaded, and document identity, deduplication, refunds, reactivation, allocation and time matching.
What is the difference between CAC and CAC payback?
CAC is the cost allocated to acquiring a new customer. Payback is the time until cumulative cohort contribution recovers that cost. Two cohorts with the same CAC can have different payback because their margin, billing, churn, implementation and cash timing differ.
What is a good LTV:CAC ratio?
There is no universally good ratio. A 3:1 heuristic is common in operator material, but its meaning depends on the LTV model, margin, retention maturity, allocation, risk and cost of capital. A high forecast ratio does not prove the company should spend more; examine marginal acquisition and realized cohorts.
Are there reliable CAC benchmarks by industry?
Benchmarks can be useful when the report discloses its sample, year, geography, segment, cost and customer definitions, maturity and distribution. Compare like with like and use the gap as a diagnostic question. A generic industry mean is not a target.
Why is my CAC so high?
First check the data contract, timing and cohort maturity. Then investigate marginal media cost, conversion and qualification, sales response, margin, retention, service cost and attribution. Reduce spend when the next increment fails the approved economics; otherwise fix the binding constraint.
Key takeaways
CAC is a management metric whose value depends on a published numerator, denominator, cohort and allocation.
Use realized contribution, payback and cash exposure before relying on forecast LTV.
A 3:1 ratio or 12-month payback is an operator heuristic, not a universal standard.
An external benchmark is useful only when its model, sample, period and definitions are comparable.
Separate platform CPA, attributed CAC, fully loaded CAC, average CAC and marginal CAC.
Reduce or reallocate spend when marginal acquisition fails the approved economics; otherwise fix the binding constraint.