
A marketing KPI is a metric selected to show progress toward a defined business objective. It needs a clear formula, an accountable owner and enough context to support a decision. Impressions, follower counts, traffic and email opens are not automatically vanity metrics: they become misleading when a team presents them as proof of business impact without connecting them to the audience, outcome or decision they are meant to inform. A useful scorecard separates business outcomes from validated leading indicators and the diagnostic metrics used to explain change.
TL;DR
- A useful KPI links an objective to a decision. Define what it measures, who owns it, when it is reviewed and what threshold prompts investigation or action.
- Context determines whether a metric is useful. Reach may be central to an awareness campaign and merely diagnostic in a sales campaign.
- Build a hierarchy: business outcomes at the top, customer or funnel drivers beneath them, channel metrics for optimisation, and diagnostics for investigation.
- Treat leading indicators as hypotheses until validated. Pipeline, qualified leads or add-to-cart rate only predict revenue if your own data shows a stable relationship.
- KPIs differ by funnel stage and business model — ecommerce, B2B and services track different things.
- A short scorecard is easier to govern. Keep the headline view focused and make supporting diagnostics available for deeper analysis.
- Attribution is not the same as incrementality. Platform-reported conversions help steer campaigns, but experiments are stronger evidence that marketing caused an outcome.
The practical test: what is this metric for?
The fastest way to clean up a marketing report is to ask five questions of every headline number:
- Which business or customer objective does it represent?
- How is it calculated, over what period and from which source?
- Who owns the result and the quality of the data?
- What comparison makes the movement meaningful: target, baseline, cohort or control group?
- What threshold prompts investigation, a decision or an experiment?
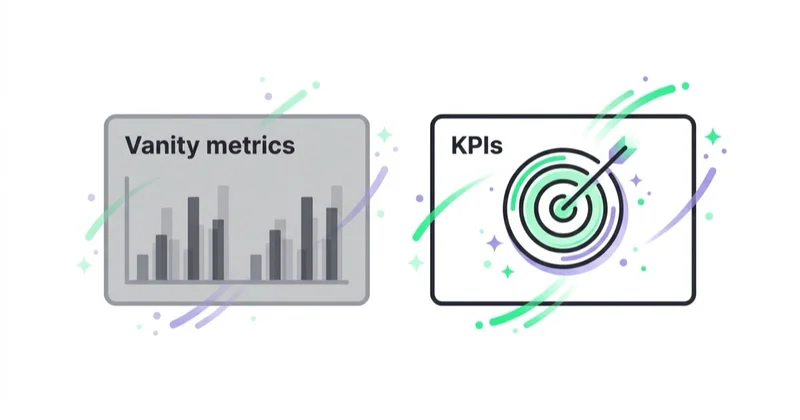
A metric becomes vanity reporting when it is selected because it looks positive rather than because it represents the objective. Impressions can rise simply because spend rises. Traffic can double after attracting visitors who never become customers. A growing follower count says little about commercial value if the audience is irrelevant or inactive. In each case, the number may still help diagnose delivery or audience growth; it just cannot carry a stronger claim on its own.
Revenue, contribution margin, customer acquisition cost, qualified pipeline and retention are closer to business performance, but even these numbers need definitions and context. Revenue may include returns or tax; CAC may omit agency fees and creative costs; pipeline may include opportunities that sales would never accept. A financially framed label does not fix an inconsistent measurement system.
Vanity metrics vs KPIs
The same raw number can be vanity or signal depending on whether it is connected to an outcome.
| Metric in isolation | Add the context or outcome needed |
|---|---|
| Impressions | Target-audience reach, frequency and brand lift for awareness; qualified outcomes and cost for performance |
| Followers | Relevant audience growth, owned-channel response, qualified leads or sales where measurable |
| Raw traffic | Engaged sessions from the intended audience, key-event rate and downstream revenue or pipeline |
| Email open rate | Delivered messages, clicks, qualified actions and revenue; opens are affected by privacy and technical factors |
| Likes / engagement | Meaningful interactions by the intended audience, assisted journeys or measured brand response |
| Ad clicks | Landing-page quality, qualified conversion rate, incremental outcomes and acquisition economics |
The pattern is not “activity bad, outcome good.” Activity metrics explain whether distribution and engagement are working; outcome and efficiency metrics show what happened later in the system. The fix is to give each number an explicit role and avoid using an upstream activity metric as evidence of downstream business impact.
Build a KPI hierarchy
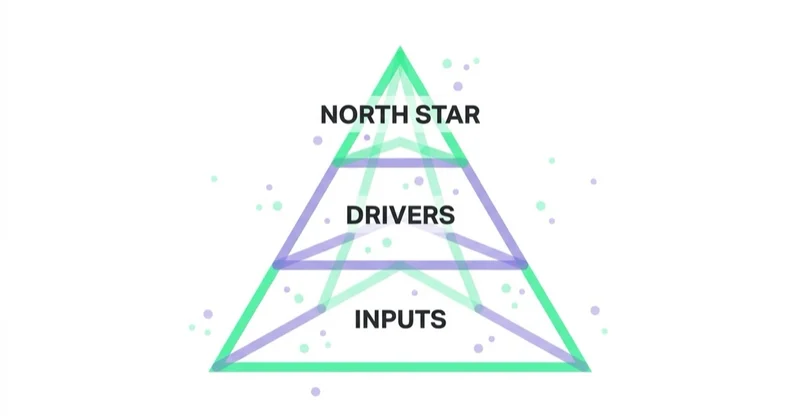
Good reporting is layered, not flat. A crowded dashboard where every metric has equal weight hides the signal; a hierarchy makes the important numbers obvious.
- Business outcomes. Revenue, contribution margin, qualified pipeline, retention or another measure aligned with the operating plan. Some businesses use one north-star metric; others need a small set of outcomes and guardrails.
- Customer and commercial drivers. Activated customers, repeat purchase rate, win rate, CAC and payback — the mechanisms expected to influence the outcomes.
- Channel KPIs. Per-channel efficiency (ROAS, cost per lead, conversion rate) used by the team to steer each channel.
- Diagnostic metrics. The activity numbers (impressions, clicks, CTR) that explain why a KPI moved, consulted when something needs investigating — not reported as headlines.
The hierarchy answers different questions at different levels. Leadership needs business outcomes, assumptions and material risks. Channel owners need the measures they can influence. Analysts need diagnostics to investigate changes. A single north star can create focus, but it can also hide margin, retention or customer-quality problems, so pair it with appropriate guardrails. The visualisation of this is covered in the companion marketing dashboard growth teams should track; this piece is about which numbers, that one is about how to show them.
Leading vs lagging indicators
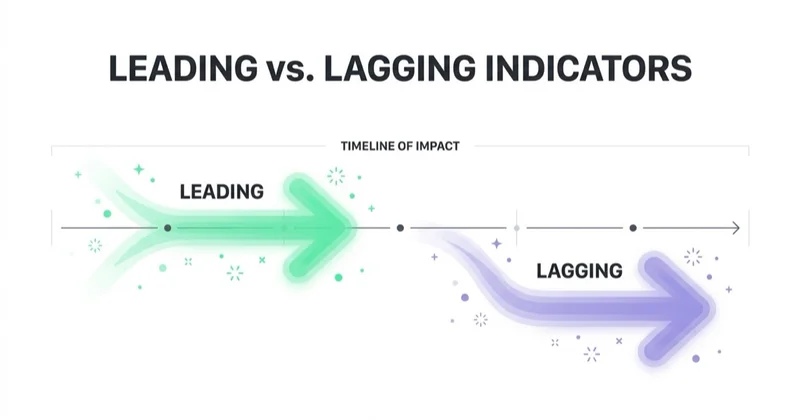
A KPI set built only on lagging indicators can confirm what happened but cannot help you act in time. The strongest sets balance both.
- Lagging indicators report an outcome after the relevant activity — recognised revenue, closed deals or retained customers. They are closer to the business result, but remain sensitive to definitions, data quality and external factors.
- Leading indicators are earlier signals that may forecast the outcome — qualified pipeline, add-to-cart rate, activated trials or accepted demo opportunities. They are useful only when their relationship with the later result is monitored and periodically revalidated.
For a business with a long sales cycle, waiting for closed revenue can delay intervention by months. Build cohorts from lead creation through opportunity and revenue, then test which early signals consistently relate to later outcomes. If the relationship weakens after a pricing, audience or sales-process change, revise the indicator rather than continuing to call it predictive.
Glossary
- KPI — a defined metric used to assess progress toward a priority objective.
- Vanity metric — a number presented as evidence of success without the context or outcome needed to support that claim.
- North-star metric — an optional focal metric intended to represent delivered customer value and sustainable growth.
- Leading indicator — an earlier signal with a tested or hypothesised relationship to a later outcome.
- Lagging indicator — a measure recorded after the activity or outcome it describes.
- Diagnostic metric — an activity number used to explain why a KPI moved, not reported as a headline.
KPIs by business model
The right KPI set depends on how the business makes money.
| Model | Core KPIs | Common vanity trap |
|---|---|---|
| Ecommerce | Contribution margin, new-customer CAC, AOV, repeat rate, conversion rate, returns | Revenue or platform ROAS without margin and returns |
| B2B / SaaS | Sales-accepted pipeline, CAC, payback, win rate, retention | MQL volume with no opportunity or revenue link |
| Services / lead gen | Cost per qualified lead, show rate, close rate, contribution per client | Raw lead count regardless of fit or sales capacity |
| Content / media | Subscriber value, retention, advertising or subscription revenue | Pageviews and time-on-site without monetisation or loyalty |
Across all of them, the trap is the same shape: a volume metric (traffic, MQLs, raw leads, pageviews) treated as success without the quality or revenue metric that gives it meaning. The discipline is to always pair a volume number with the outcome number that qualifies it.
Every KPI needs a measurement contract
A metric name is not a definition. “CAC,” “marketing-sourced revenue,” and “qualified lead” often mean different things to marketing, sales, and finance. Each KPI needs a written formula, source system, included costs, time zone, currency convention, refresh cadence, owner, and decision threshold.
The dashboard should expose data quality as well as performance. Useful controls include the share of events with a stable ID, deduplication rate, percentage of leads with a current CRM stage, and last validation date. Missing data must not silently become zero.
Record changes to definitions and tracking in a measurement log. Otherwise a redesigned form, revised CRM stage or new attribution setting can look like a performance shift. Google Analytics also warns that reports and explorations can differ because of factors such as filtering, low user counts, behavioural modelling and processing time. A dashboard should therefore expose its source and limitations instead of presenting every value as exact.
Each KPI should map to a class of decisions, while monitoring metrics can remain on the report even when they do not require immediate action. This turns reporting into an early-warning and resource-allocation system without forcing a reaction to normal variation.
How Space Ads approaches marketing KPIs
In a KPI audit, we start with the operating plan and the decisions the report must support. We then reconcile marketing definitions with sales and finance, review event and CRM quality, and separate headline outcomes from channel controls and diagnostics. This prevents a platform metric from being mistaken for the whole-business result.
The resulting scorecard can use one north star or several balanced outcomes, depending on the business. Every headline KPI gets an owner, formula, comparison and decision threshold. Leading indicators are labelled as hypotheses until cohort analysis or experiments support the relationship. Platform attribution remains useful for optimisation, while incrementality tests answer the separate question of what the activity caused. That reporting backbone supports web analytics and performance marketing; a fractional CMO can align it with leadership and finance.
Stop doing / Do instead
| Stop doing | Do instead |
|---|---|
| Reporting impressions, followers and raw traffic as proof of commercial success | State their role and pair them with the relevant audience or outcome measure |
| Treating every metric with equal weight | Build a hierarchy of outcomes, drivers, channel controls and diagnostics |
| Treating an early metric as inherently predictive | Validate its relationship with the later outcome and recheck it over time |
| Celebrating volume without quality | Pair every volume metric with an outcome metric |
| Crowding the dashboard | Track fewer KPIs closely; keep diagnostics for investigation |
| Reporting numbers with no owner | Give every KPI an owner and a decision it informs |
FAQ
What is a marketing KPI?
A marketing KPI is a clearly defined metric used to assess progress toward a priority business objective, such as contribution margin, new-customer acquisition cost or qualified pipeline. It should have a formula, source, owner, comparison and an agreed role in a decision.
What are vanity metrics in marketing?
Vanity metrics are numbers presented as proof of success without enough context to justify that conclusion. Impressions, follower counts, traffic, likes and email opens can all be useful diagnostics or valid campaign measures. They become vanity reporting when the team ignores audience quality, business outcomes or measurement limitations.
What marketing KPIs should a company track?
Start with the operating objective and select a small set of business outcomes and guardrails. Add validated customer or funnel drivers, channel KPIs for optimisation and diagnostics for investigation. The exact set depends on the business model, economics, sales cycle and decision cadence; there is no universal list or mandatory number of KPIs.
What is the difference between leading and lagging indicators?
Lagging indicators describe an outcome after the relevant activity, such as recognised revenue or closed deals. Leading indicators are earlier signals, such as sales-accepted pipeline or activated trials. They should only be described as predictive after the business has tested their relationship with the later outcome.
How many marketing KPIs should you track?
There is no universal number. Keep the headline scorecard small enough for its audience to understand trade-offs, but large enough to include the primary outcome, material drivers and guardrails such as margin, retention or data quality. Put channel and diagnostic detail in drill-down views.
Is website traffic a vanity metric?
Not necessarily. Traffic can be a valid reach or demand indicator for a publishing, awareness or self-service objective. It is misleading when presented as commercial success without audience quality or downstream outcomes. Segment it by source and intent, then connect it to engagement, key events, pipeline, revenue or subscriber value as appropriate.
Key takeaways
- A useful KPI connects a business objective to a defined metric, owner, comparison and decision.
- No metric is inherently vain; the problem is presenting activity without the context needed to support the claim.
- Build a hierarchy of business outcomes, customer and commercial drivers, channel controls and diagnostics.
- Validate leading indicators against later outcomes instead of assuming that they predict them.
- Separate attributed results used for optimisation from incremental effects established through suitable experiments.
Sources and further reading
- Google Analytics Help — Key events and conversions
- Google Analytics Help — Why data can differ between reports and explorations
- Google Analytics Help — About data sampling
- Google Ads Help — The statistical methodology behind experiments
Continue learning
- The marketing dashboard growth teams should track across ads, SEO and sales
- MER vs ROAS: the blended metric your board should track
- Customer acquisition cost benchmarks by industry
- What is a conversion: micro and macro conversions
- Web analytics that ties spend to revenue
- Fractional CMO: marketing measured in numbers you can act on
Continue reading
MER vs ROAS: The Blended Metric Your Board Should Actually Track
MER is a useful whole-business efficiency control; platform ROAS is an attribution-based operating signal. Learn to define both, avoid additive errors and connect them with contribution and incrementality.

How a CEO Should Read the Marketing Numbers: A P&L View of Growth
A CEO needs a one-page decision view of marketing—not a platform scorecard. This guide connects revenue, contribution, CAC, cohort payback, pipeline, cash and marginal return while showing where blended ratios such as MER can mislead.
Customer Acquisition Cost Benchmarks by Industry (and What a 'Good' CAC Really Is)
There is no universal 'good' customer acquisition cost. CAC only means something next to gross margin, lifetime value and payback period — and against your own model, not a benchmark. This guide explains how to calculate it correctly and how to read industry numbers without being misled.


































