
Conversion rate is the percentage of users, sessions or clicks that complete a desired action. The basic formula is: conversion rate = conversions / users or sessions x 100%. The formula is simple, but the interpretation is not. A conversion rate only makes sense when the conversion action, traffic source, device, funnel stage and business value are clear.
A high conversion rate is not automatically good. A low conversion rate is not automatically bad. A blog article, a brand search campaign, a cold social ad, a product page, a checkout step and a demo form all have different intent. The goal is not to chase a universal benchmark. The goal is to understand where the right users fail to take the next valuable step and then remove the biggest barriers.
TL;DR
- Conversion rate measures the share of visitors who complete a desired action. The action can be a purchase, lead, booking, signup, download, call or any meaningful step.
- The denominator matters. Conversion rate can be calculated from users, sessions, clicks or leads, and each method answers a different question.
- Average site-wide conversion rate is often misleading. Segment by channel, device, page type, market, campaign, user type and funnel stage.
- Micro-conversions explain the path. Product views, CTA clicks, form starts, add-to-cart events and checkout starts show where users drop before the final conversion.
- CRO is not random button testing. It is a process of finding barriers, forming hypotheses, changing the experience and measuring business impact.
- Good conversion rate optimization protects quality. Lead quality, revenue, margin, retention and customer lifetime value matter more than the percentage alone.
- Measurement must be checked first. Broken GA4 events, duplicate purchases, consent issues or bad UTMs can make conversion rate analysis unreliable.
What conversion rate means
Conversion rate, often shortened to CR, shows what percentage of a defined audience completed a defined action.
The standard formula is:
Conversion rate = number of conversions / number of users, sessions or clicks x 100%
Example:
40 purchases / 2,000 sessions x 100% = 2% session conversion rate
The same store could also calculate:
- user conversion rate;
- session conversion rate;
- click-to-conversion rate;
- product page add-to-cart rate;
- cart-to-checkout rate;
- checkout-to-purchase rate;
- lead-to-qualified-lead rate;
- demo-to-customer rate.
Each metric is useful for a different decision. A marketing team may care about click-to-lead conversion rate. An ecommerce manager may care about product page add-to-cart rate. A sales team may care about lead-to-opportunity rate. A finance team may care about profit per session.
Conversion rate vs conversion
A conversion is the action. Conversion rate is the percentage of people or sessions that completed it.
For example:
- conversion: 120 demo requests;
- conversion rate: 4% of landing page sessions submitted the demo form.
This distinction matters because conversion volume and conversion rate can move in different directions. A campaign can increase total conversions while lowering conversion rate if it brings more broad traffic. Another campaign can have a high conversion rate but low total volume because traffic is small.
For definitions of conversion types, read What Is a Conversion? Micro-Conversions and Macro-Conversions.
Macro-conversions and micro-conversions
Macro-conversions are the main business actions:
- purchase;
- qualified lead;
- booked consultation;
- subscription;
- trial signup;
- paid account;
- quote request.
Micro-conversions are meaningful steps on the way:
- product view;
- add to cart;
- begin checkout;
- CTA click;
- form start;
- file download;
- newsletter signup;
- pricing page view;
- account creation;
- call click;
- chat start.
Micro-conversions help diagnose the funnel. If purchases fall, the problem may not be the checkout itself. It may be fewer product views, a weaker add-to-cart rate, lower checkout starts or a payment problem. Without micro-conversions, the final number hides the cause.
Conversion rate vs CTR
CTR and conversion rate are often confused.
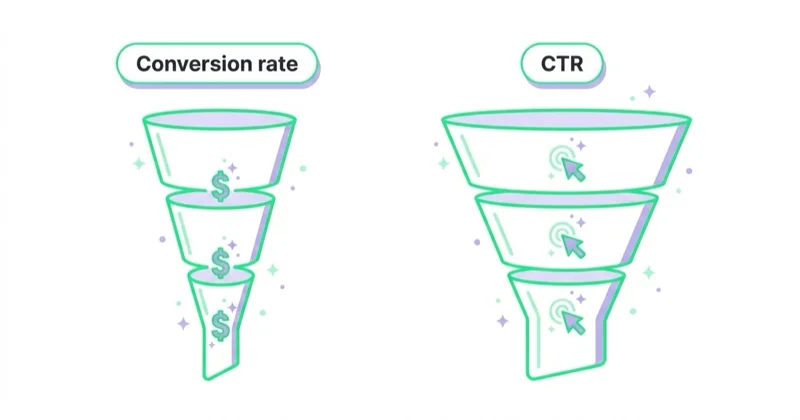
| Metric | Formula | Main question |
|---|---|---|
| CTR | clicks / impressions x 100% | Does the ad, listing or link get attention? |
| Conversion rate | conversions / users, sessions or clicks x 100% | Does the post-click experience create action? |
A high CTR with a low conversion rate often means the ad attracts attention but the landing page, offer or traffic quality does not match user expectations. A low CTR with a high conversion rate may mean the offer is strong for a small, precise audience but the ad does not win enough clicks.
Both metrics need context. A sensational ad can increase CTR and hurt conversion quality. A narrower ad can reduce CTR but improve qualified leads or revenue.
Why site-wide conversion rate can mislead
The average conversion rate of a whole website is usually too broad for decision-making.
It mixes:
- branded and non-branded traffic;
- warm and cold audiences;
- mobile and desktop users;
- paid and organic sessions;
- blog readers and product buyers;
- returning customers and first-time visitors;
- different countries and currencies;
- different product categories;
- different funnel stages.
If organic blog traffic grows, total site conversion rate may fall even while revenue increases. If a brand campaign brings returning users, conversion rate may rise without proving that prospecting improved. If mobile traffic increases, overall conversion rate may drop because mobile users behave differently.
Always segment before drawing conclusions.
Useful segments:
- traffic source and medium;
- campaign;
- device;
- landing page;
- page type;
- new vs returning users;
- country or region;
- product category;
- audience type;
- funnel step;
- logged-in vs anonymous users;
- customer vs prospect.
What is a good conversion rate?
There is no universal good conversion rate.
A "good" result depends on:
- industry;
- price point;
- traffic intent;
- brand awareness;
- product availability;
- market maturity;
- offer strength;
- device mix;
- seasonality;
- sales cycle length;
- conversion definition;
- lead quality;
- margin.
Benchmark reports can be useful for orientation, but they should not replace internal analysis. The most useful benchmark is usually the same segment over time: mobile paid search landing page conversion rate this month versus last month, or checkout completion rate before and after a form change.
For ecommerce, public research from Baymard is useful because it shows how much friction can exist in checkout, but even there the lesson is not to copy a number. The lesson is to identify which friction points affect a specific store.
What affects conversion rate?
Conversion rate is shaped by three groups of factors: traffic, offer and experience.
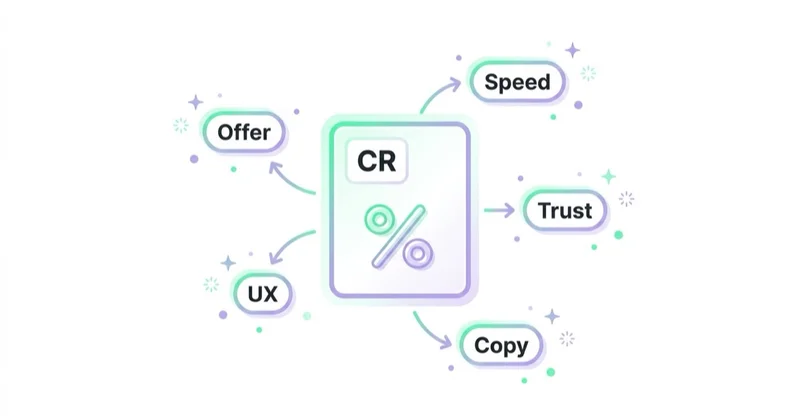
Traffic quality
Traffic quality depends on who arrives and why.
Check:
- keyword intent;
- audience targeting;
- ad promise;
- email list quality;
- affiliate or referral quality;
- geography;
- device;
- funnel stage;
- new vs returning users.
If the wrong audience arrives, even a strong page will struggle. CRO cannot fully fix poor targeting or a misleading ad.
Offer strength
The offer includes product, price, value, risk, urgency, availability and differentiation.
Questions:
- Is the value clear?
- Is the price justified?
- Is the product in stock?
- Is delivery acceptable?
- Is the lead magnet worth the form?
- Is the demo or consultation credible?
- Is the next step too demanding for the user's stage?
Sometimes conversion rate increases because the page improved. Sometimes it increases because the offer became stronger.
User experience
UX determines whether users can act easily.
Common blockers:
- unclear headline;
- weak CTA;
- slow load;
- layout shifts;
- confusing navigation;
- too many form fields;
- unclear delivery costs;
- weak trust proof;
- poor product photos;
- mobile friction;
- inaccessible controls;
- broken validation;
- payment errors;
- intrusive pop-ups.
For page-specific improvement, see What Is a Landing Page and How to Build One? and What Is a CTA and How to Create an Effective Call to Action?.
How to increase conversion rate step by step
1. Define the conversion correctly
Decide what the conversion means. A newsletter signup, sales-qualified lead, quote request and purchase are not equivalent. If several actions matter, separate primary and secondary conversions.
2. Validate measurement
Before optimizing, check whether the data is trustworthy.
Review:
- GA4 events;
- key events;
- ecommerce events;
- duplicate purchase events;
- payment provider referrals;
- cross-domain tracking;
- UTM consistency;
- Google Ads and Meta conversions;
- consent behavior;
- CRM mapping;
- backend revenue reconciliation.
Google Analytics recommended events and ecommerce event documentation can help align event names and parameters with GA4 reporting. Bad data makes conversion optimization guesswork.
For measurement detail, see Google Analytics 4: Why Implement It and What Are the Benefits?.
3. Segment the funnel
Do not start with the average. Find where the drop happens.
For ecommerce:
- session to product view;
- product view to add to cart;
- add to cart to checkout start;
- checkout start to payment;
- payment to purchase.
For lead generation:
- landing page view to CTA click;
- CTA click to form start;
- form start to submit;
- submitted lead to qualified lead;
- qualified lead to meeting;
- meeting to sale.
The biggest drop-off is not always the biggest opportunity. Prioritize by impact, difficulty and business value.
4. Add qualitative evidence
Use behavior tools, surveys, customer support data and sales feedback to understand why users stop.
Helpful sources:
- Hotjar or Microsoft Clarity recordings;
- heatmaps;
- on-page surveys;
- exit surveys;
- customer interviews;
- live chat transcripts;
- sales objections;
- support tickets;
- search queries with no results.
For qualitative analysis, see Why Use Hotjar on Your Website?.
5. Build a hypothesis
A useful hypothesis connects observation, cause and expected effect.
Weak:
- "Change the button color."
Better:
- "Mobile users may not understand the next step because the CTA appears below a long trust section. Moving the CTA closer to the value proposition should increase form starts."
Strong hypotheses make changes easier to evaluate.
6. Fix obvious defects before testing
Not every improvement needs an A/B test. Broken forms, payment errors, inaccessible controls, misleading prices, missing mobile labels and severe layout shifts should be fixed as quality issues.
A/B testing is useful when there are two plausible versions and enough traffic to detect a difference. Low-traffic sites should rely more on research, best practices and before-after monitoring.
7. Measure business impact
Conversion rate is not the end. Measure:
- conversion volume;
- revenue;
- average order value;
- margin;
- lead quality;
- pipeline value;
- close rate;
- retention;
- refund or return rate;
- customer lifetime value.
A change that increases lead volume but reduces qualification may hurt the business. A change that reduces conversion rate but increases average order value or qualified pipeline may be positive.
Conversion rate in ecommerce
Ecommerce conversion rate should be broken down by product and journey stage.
Important metrics:
- product view rate;
- add-to-cart rate;
- cart abandonment;
- checkout start rate;
- checkout completion rate;
- purchase conversion rate;
- revenue per session;
- average order value;
- margin per order;
- return rate;
- repeat purchase rate.
Common ecommerce conversion blockers:
- weak product images;
- missing size or compatibility information;
- unclear delivery cost;
- no guest checkout;
- limited payment options;
- unexpected fees;
- slow mobile experience;
- out-of-stock variants;
- confusing coupon fields;
- lack of trust proof;
- poor search and filters.
For a full store diagnosis, read How to Audit an Ecommerce Store.
Conversion rate in lead generation
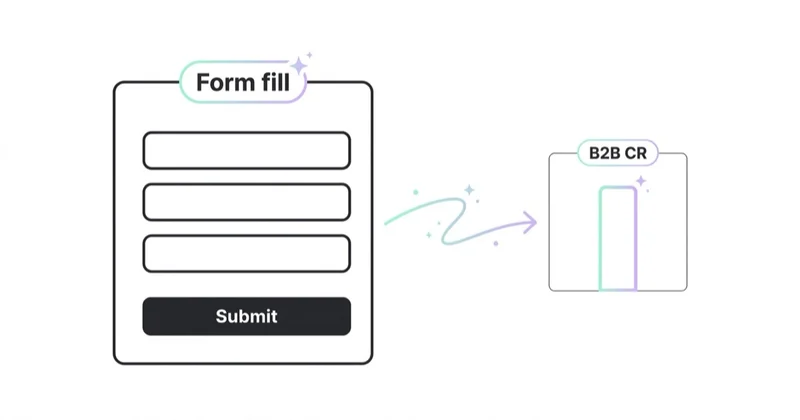
Lead generation conversion rate can be deceptive because not all leads are equal.
Track:
- form conversion rate;
- cost per lead;
- cost per qualified lead;
- meeting booking rate;
- show-up rate;
- sales opportunity rate;
- close rate;
- revenue per lead;
- spam or invalid lead rate.
If a shorter form doubles lead volume but triples low-quality submissions, it may not help. If a longer form lowers conversion rate but improves sales qualification, it may be better for the business.
The right form length depends on intent. A cold visitor downloading a checklist needs little friction. A high-value B2B quote request may justify more fields if they improve qualification.
Conversion rate and Core Web Vitals
Core Web Vitals measure parts of user experience that can affect conversion paths:
- LCP: how quickly the main content loads;
- INP: how responsive the page feels after interaction;
- CLS: how stable the layout is.
For conversion rate, performance matters most on high-intent pages:
- landing pages;
- product pages;
- cart;
- checkout;
- pricing pages;
- lead forms;
- booking flows.
A fast blog page does not compensate for a slow checkout. Measure the pages where users make decisions.
30-day conversion rate improvement plan
Days 1-3: define metrics
Choose the primary conversion, supporting micro-conversions, denominator and reporting segments.
Days 4-6: validate tracking
Check GA4, ad platforms, CRM, ecommerce backend, UTMs, consent behavior and duplicate events.
Days 7-10: map the funnel
Identify the largest drop-offs by device, source, page type and audience.
Days 11-14: collect qualitative evidence
Review recordings, heatmaps, surveys, support tickets, sales objections and customer search behavior.
Days 15-18: prioritize barriers
Score issues by impact, confidence, effort and business value. Separate defects from test ideas.
Days 19-23: implement the first changes
Fix critical blockers: form errors, checkout issues, unclear CTA, hidden delivery costs, slow assets or mobile layout problems.
Days 24-30: measure and plan the next iteration
Compare conversion rate, conversion volume, quality and revenue. Document what changed and what should be tested next.
How we approach this at Space Ads
An average conversion rate is close to useless, because it buries huge gaps between devices, sources and intent. So we never optimise "the one CR" — we split it: mobile against desktop, paid against organic, brand against generic. Only then does the real problem show, and we take the segment with both heavy traffic and a weak result, because that's where the most is recoverable. We also keep a trap in view: the global CR can move purely because the traffic mix changed, not because anything got better or worse. A bump right after a brand campaign goes live isn't an optimisation win, it's different traffic. Without segmentation, it's easy to celebrate or panic for entirely the wrong reason.
Common mistakes
| Mistake | Why it hurts | Better approach |
|---|---|---|
| Chasing a generic benchmark | Ignores context | Compare relevant segments over time |
| Optimizing site-wide CR only | Hides funnel problems | Segment by source, page and device |
| Counting weak leads as success | Inflates performance | Track qualified leads and revenue |
| Testing random design changes | Produces noise | Start with evidence and hypotheses |
| Ignoring measurement errors | Makes analysis unreliable | Audit events before optimizing |
| Improving CR at the cost of margin | Hurts profit | Track revenue, margin and LTV |
| Running A/B tests with too little data | Leads to false confidence | Use research and before-after analysis when traffic is low |
FAQ
What is conversion rate?
Conversion rate is the percentage of users, sessions or clicks that complete a desired action. The action can be a purchase, lead, signup, booking, download, call or another defined goal.
How do you calculate conversion rate?
Use: conversions divided by users, sessions or clicks, multiplied by 100%. The denominator must stay consistent when comparing results.
What is a good conversion rate?
It depends on industry, traffic source, intent, device, offer, price, market and conversion definition. Internal segment comparison is usually more useful than a generic benchmark.
How can conversion rate be increased?
Start by finding the biggest barrier in the funnel. Then improve traffic match, offer clarity, trust, speed, UX, forms, checkout, CTA, product content or measurement depending on the evidence.
Is conversion rate the same as CRO?
No. Conversion rate is the metric. CRO, or conversion rate optimization, is the process used to improve conversion outcomes.
Should every conversion rate change be A/B tested?
No. Obvious defects should be fixed directly. A/B testing is best for uncertain changes when there is enough traffic and conversion volume for a meaningful result.
Why did conversion rate fall while revenue increased?
This can happen when broader traffic grows, lower-intent traffic increases, average order value rises, returning users change, or a new content channel brings more early-stage visitors. Segment before reacting.
Can AI improve conversion rate?
AI can help analyze feedback, summarize session patterns, draft hypotheses and generate copy variants. It does not replace tracking validation, user research, UX judgement or business prioritization.
Conclusion
Conversion rate is useful because it connects user behavior with business outcomes. But the number alone is not enough. It must be defined, segmented and interpreted with context. The same percentage can mean very different things depending on source, device, offer, funnel stage and conversion quality.
The strongest conversion work starts with measurement, then diagnoses the funnel, then uses qualitative evidence to understand friction. The goal is not to make every visitor convert. The goal is to help the right visitors take the right next step with less confusion, less risk and more confidence.
Sources and further reading
- Google Analytics - Recommended events
- Google Analytics - Measure ecommerce
- Google web.dev - Web Vitals
- Google Search Central - Core Web Vitals and Google Search
- Microsoft Clarity
- Baymard Institute - Cart abandonment statistics
Continue learning
- What Is a Conversion? Micro-Conversions and Macro-Conversions
- What Is Conversion Rate Optimization (CRO) and How to Increase Sales?
- Why Use Hotjar on Your Website?
- What Is a Landing Page and How to Build One?
- How to Audit an Ecommerce Store
- Google Analytics 4: Why Implement It and What Are the Benefits?
Continue reading
Conversion Optimization: A Complete Guide for E-commerce, B2B, SaaS and Services
Conversion optimization improves the percentage and quality of visitors who become customers, leads, users or booked appointments. This guide explains how to diagnose friction before scaling paid ads.
How to Increase Online Sales
Online sales grow when offer, traffic, UX, measurement, trust and retention work together. Learn how to diagnose and improve the full funnel.

Free Shipping Strategy for Online Stores (Threshold, Margin, When)
Free shipping can improve the offer, but only when the additional contribution it generates exceeds the delivery subsidy. Learn how to choose a model, calculate a threshold and test the impact on profit rather than AOV alone.


































