
An ecommerce conversion rate usually expresses completed purchases as a share of sessions, visitors, or users. The denominator, purchase event, attribution rules, consent coverage, bot filtering, market, device, and traffic mix all affect the result. That is why two credible reports can publish different figures for the same category—and why Shopify and GA4 can disagree for the same store.
An external benchmark can provide context only after its population and formula are comparable to yours. For operating decisions, use a validated internal baseline segmented by the factors that materially change buying behavior.
TL;DR
- There is no single authoritative ecommerce average. A headline percentage without source, dates, sample, market, and formula is not decision-ready.
- Industry is only one comparison dimension. Price, purchase frequency, product availability, business model, and customer mix can matter as much or more.
- Device and traffic mix change the blended rate. Compare like with like instead of assuming a lower blended figure means a worse site.
- Definitions differ. Shopify defines online store conversion as sessions resulting in an order; GA4 relies on configured ecommerce events and its own session logic.
- Validate measurement before optimisation. Consent, duplicate or missing purchase events, payment-domain referrals, bots, and cross-domain tracking can move the number.
- Use external ranges as investigation prompts. Set targets from economics, funnel capacity, and controlled improvement—not a generic percentile.
What "conversion rate" even means (and why two numbers differ)
Before comparing anything, record the numerator and denominator. Common formulas include completed-checkout sessions divided by all online-store sessions, purchases divided by sessions, and purchasers divided by users. One person can create several sessions, and one session can contain more than one purchase event. Shopify's standard online-store metric uses sessions that resulted in a sale. GA4 distinguishes purchases, ecommerce purchases, transactions, users, and estimated sessions; the selected metrics and ecommerce implementation matter.
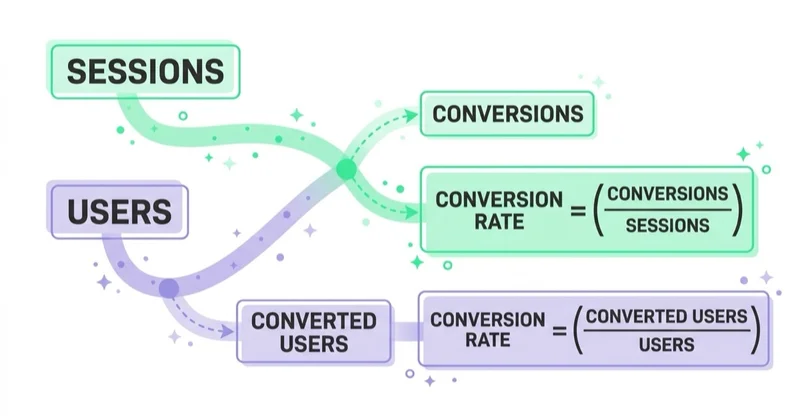
Consent and identity rules create further differences. Shopify notes that some session fields depend on visitor cookie consent and that other analytics platforms calculate sessions differently. GA4 estimates unique session IDs and uses its configured reporting identity. Reconcile trends and known causes; do not force two systems to match exactly without understanding their scopes.
How industry patterns should be interpreted
Published datasets often show category differences, but a category label does not control for price, channel, geography, brand maturity, or sample composition. Use directional expectations to frame questions, not to assign an “acceptable” rate.
| Category pattern | Why conversion may differ | What to compare before drawing a conclusion |
|---|---|---|
| Replenishable or habitual products | Existing need, shorter reorder cycle, more returning customers | New vs returning mix, subscription share, order interval, stock availability |
| Fashion and beauty | Browsing, variants, fit or shade uncertainty, returns | Price band, mobile mix, return policy, product-page and variant behavior |
| Electronics and technical products | Comparison, compatibility, promotion cycles, higher prices | Branded vs generic traffic, model availability, assisted and offline sales |
| Home, furniture, and high-ticket goods | Longer consideration, delivery constraints, cross-device research | Lead or store-visit outcomes, region, delivery coverage, conversion window |
| Luxury | Selective distribution, low purchase frequency, high average order value | Clienteling, assisted sales, new-customer rate, contribution per visitor |
These are hypotheses, not laws. A premium store with strong direct demand may outperform a low-price store buying broad traffic. A grocery service with limited delivery coverage may appear weak if ineligible sessions remain in the denominator. The benchmark is useful only when it helps isolate the next question.
Why the benchmark you found probably doesn't apply
Even within the right industry, several factors distort the comparison enough that an external benchmark rarely maps to your store.
- Device mix. Mobile and desktop users can differ in intent, context, payment friction, and cross-device behavior. Compare device-specific rates before interpreting the blend.
- Traffic source and campaign job. Branded search, lifecycle messages, affiliates, prospecting, and content can bring visitors at different stages. Source labels alone do not prove intent, so inspect campaign and landing-page context.
- Brand, price, and availability. Recognition, proposition, price point, stock, delivery coverage, and promotion intensity all affect conversion.
- New and returning customers. The mix changes the blended rate, but browser-based “returning” labels may not identify people perfectly across devices and consent states.
- Definition and data quality. Formula, bot handling, duplicate transactions, refunds, cross-domain setup, and excluded traffic must be comparable.
Ask the source five questions: What period and countries are included? Which stores and categories qualify? What is the exact formula? Is the statistic a mean, median, or percentile? Are devices, traffic sources, and customer types separated? If these answers are unavailable, treat the figure as editorial context rather than evidence.
Glossary
- Conversion rate — a defined conversion numerator divided by an eligible session or user denominator over the same period. For example, Shopify's online-store rate uses sessions that resulted in an order, while a GA4 calculation may use purchase events, purchasers, or purchasing sessions and therefore answer a different question.
- Session vs user — a user can have multiple sessions, so the two denominators give different rates.
- Blended conversion rate — all traffic combined, hiding device and source differences.
- Branded traffic — traffic associated with searches or campaigns containing a brand term; its apparent performance can still depend on attribution rules.
- New vs returning — an analytics classification based on available identifiers, not a perfect customer-level distinction.
- Micro-conversion — a smaller step (add-to-cart, signup) short of purchase.
- AOV — average order value; low-CVR high-AOV stores can be more profitable than the reverse.
Use benchmarks to pressure-test, not to target
Use a credible benchmark to form a diagnostic question. A large gap may justify checking measurement, traffic eligibility, site performance, product availability, offer-market fit, payment, or checkout. Being near a published average is not proof that the experience is healthy or that no profitable improvement remains.
Conversion rate can also be raised in harmful ways: restricting prospecting to existing demand, over-discounting, hiding low-margin products, or excluding valid sessions. Set goals alongside contribution margin, new-customer volume, AOV, returns, repeat behavior, and traffic scale. This is the same logic that applies to CAC benchmarks.
Build the only baseline that matters: your own
Your store's own conversion rate, trended over time and segmented properly, is the benchmark that actually tells you whether you are improving. The segments that matter most:
- By device — track mobile and desktop separately; a blended number hides where the problem is.
- By traffic source — branded, non-branded paid, email, social and direct convert very differently; judge each against itself.
- By new vs returning — so improvements in acquisition aren't masked by strong repeat conversion (or vice versa).
- By landing page / campaign — so you can see which entry points convert and which leak.
- By market and product group — especially when price, stock, delivery, or payment options differ.
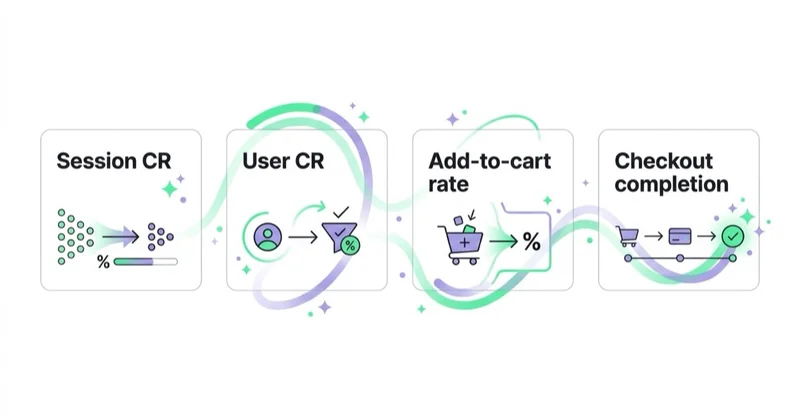
- By funnel step — product view, cart addition, checkout reach, payment, and completion to locate the constraint.
Annotate promotions, consent changes, redesigns, tracking releases, and stock events. Use controlled experiments for material changes where volume permits, because a before-and-after trend can be moved by mix and seasonality. Improvement is the domain of conversion rate optimization and landing page design, measured through analytics tied to revenue.
How Space Ads approaches conversion benchmarks
At Space Ads, benchmark work begins with a measurement specification: source system, numerator, denominator, timezone, market, refund treatment, consent coverage, and segment definitions. We reconcile Shopify or another commerce platform with GA4 at the level of known differences rather than treating either dashboard as unquestionable truth.
We then build an internal baseline by device, source or campaign, market, customer type, product group, and funnel step. External data is used only when its methodology is sufficiently comparable. Changes are judged against business economics and, where practical, controlled experiments. That discipline lives in web analytics, and the improvement work in conversion optimization.
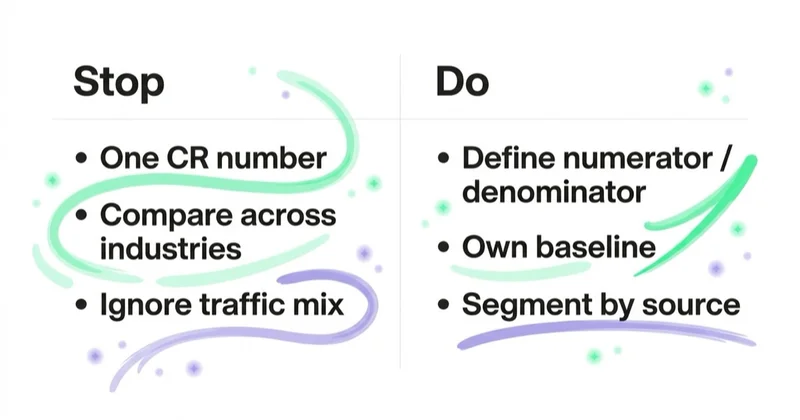
Stop doing / Do instead
| Stop doing | Do instead |
|---|---|
| Comparing your blended rate to an industry average | Compare your own segmented baseline over time |
| Treating a benchmark as a target | Use it to pressure-test; set targets from your economics |
| Judging on one blended number | Split by device, source, and new vs returning |
| Assuming a low rate is bad | Read it against AOV and repeat rate — profit, not CVR, is the goal |
| Comparing across incompatible definitions | Confirm both numbers use the same formula first |
Common mistakes
Common mistakes include using an unattributed source, comparing means with medians, mixing Shopify and GA4 definitions, ignoring consent and bots, comparing a promotion period with a normal week, and optimising the blended rate by cutting new-customer traffic. Another is celebrating higher conversion while contribution margin, order quality, or total new customers fall.
FAQ
What is a good ecommerce conversion rate?
There is no universal good rate. A useful target is defined for the same formula and segment, reflects the store's economics and traffic strategy, and is compared with a validated baseline. Published figures without methodology should not set the target.
What is the average conversion rate by industry?
Habitual, lower-consideration categories may show higher purchase rates than expensive, infrequent, or comparison-heavy categories. Exact numbers vary with the dataset, market, date, formula, and customer mix. Use only a source whose methodology and population are comparable to yours.
Why is my conversion rate below the industry average?
First verify the comparison and tracking. Then segment by device, campaign, market, customer type, product, and funnel step. A lower rate can reflect different traffic or economics, but it can also reveal a genuine offer, availability, speed, payment, or checkout problem.
Does device affect ecommerce conversion rate?
Yes. Device influences context, interface, payment options, and cross-device journeys, so the mix can materially change a blended rate. Compare mobile and desktop separately, but do not assume every store must reproduce a generic desktop advantage.
How do I calculate my ecommerce conversion rate?
For a session conversion rate, divide sessions with a completed purchase by eligible sessions in the same scope and period. Document the purchase event, session definition, timezone, consent, bot treatment, and exclusions. A user conversion rate uses purchasers or purchasing users over users and answers a different question.
Should I use conversion rate benchmarks at all?
Yes, but only to pressure-test, not to set targets. If your rate is far outside a credible range for your category and traffic type, that is a prompt to investigate a possible problem. Adopting an external benchmark as a goal ignores your own economics and traffic mix, which is why your own segmented baseline over time is the benchmark that actually guides decisions.
Key takeaways
- No single percentage is an authoritative ecommerce conversion benchmark across stores.
- Check the formula, sample, market, period, statistic, and mix before using an industry comparison.
- Reconcile platform definitions and validate purchase, session, consent, bot, and cross-domain measurement.
- Use a segmented internal baseline and controlled experiments to guide optimisation.
- Evaluate conversion with traffic scale, new customers, AOV, margin, returns, and repeat behavior.
Sources and further reading
- Shopify Help Center — Measuring marketing performance and online store conversion
- Shopify Help Center — Conversion rate and behaviour reports
- Google Analytics Help — About ecommerce metrics
- Google Analytics Help — How GA4 sessions are calculated
Continue learning
Continue reading
PPC Landing Pages: Why Your Ad Clicks Don't Convert (and How to Fix It)
Clicks without business results can point to traffic quality, tracking, the landing page or follow-up. This guide shows how to diagnose the full PPC journey and improve message continuity, mobile use, forms and measurement.

High-Converting Landing Page Design: The Patterns That Actually Work
A strong landing page makes the offer, evidence and next step easy to understand for a specific audience. Learn how to design, measure and test message match, forms, proof, accessibility and performance.

Landing Page Mistakes That Kill Conversions (and How to Fix Them)
Landing pages often underperform because the promise, path to action or measurement is unclear. This guide shows how to diagnose message mismatch, mobile friction, forms, proof and tracking without relying on universal CRO rules.


































