
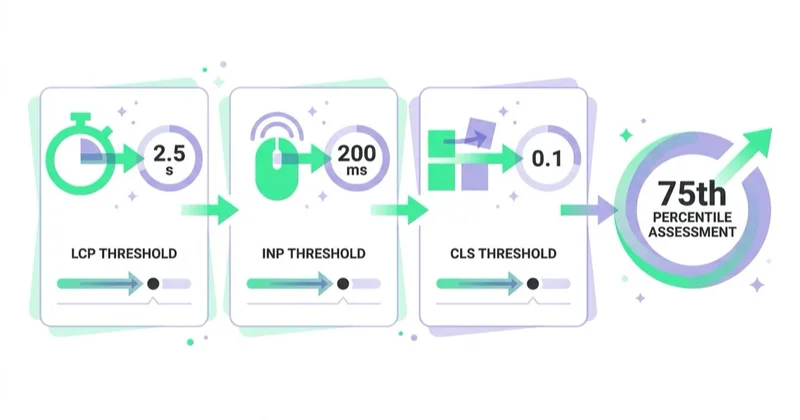
Core Web Vitals are three metrics Google uses to describe the experience of loading and using a page: Largest Contentful Paint (LCP) for loading, Interaction to Next Paint (INP) for responsiveness, and Cumulative Layout Shift (CLS) for visual stability. A URL group passes when the 75th percentile of real visits sits at or below 2.5 seconds for LCP, 200 milliseconds for INP and 0.1 for CLS, assessed separately on mobile and desktop. Passing them is engineering work on images, scripts, fonts and reserved space, not a setting to switch on.

This article is about that work. For each metric, it explains what is measured, where the time goes, which causes recur in templates and how to verify a fix. It also explains why a single PageSpeed Insights run cannot describe the experience of all users and why Google does not define a separate Core Web Vitals threshold for generative Search features.
TL;DR
- Good thresholds: LCP ≤ 2.5 s, INP ≤ 200 ms, CLS ≤ 0.1, at the 75th percentile of page loads, segmented across mobile and desktop.
- Field data decides, lab data diagnoses. Google's guidance is that lab measurement "is not a substitute for field measurement", so one PageSpeed run is evidence about that run only.
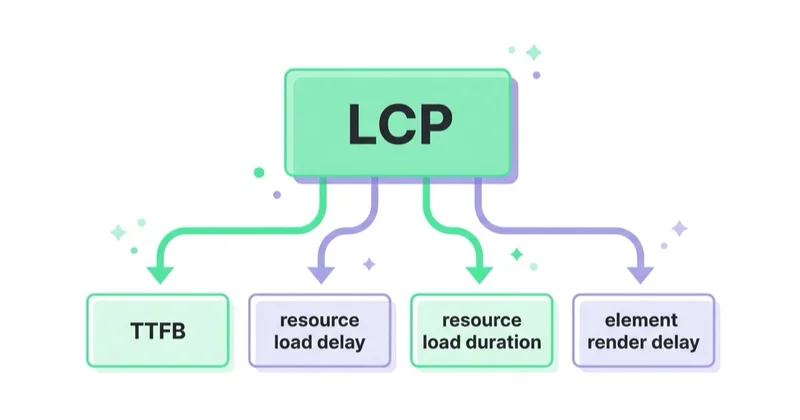
- LCP is four sequential parts (TTFB, resource load delay, load duration, render delay) and INP is three phases (input delay, processing, presentation). Diagnose the dominant phase before choosing a fix.
- Common CLS causes involve unreserved or changing space: images without dimensions, ad slots and embeds, font metric changes and banners that push existing content after paint.
- Google confirms Core Web Vitals "are used by our ranking systems" and, in the same document, that good scores do not guarantee top rankings.
- AI search adds no separate Core Web Vitals threshold. Google's generative Search guidance uses the same technical and content foundations as ordinary Search.
- Prioritise by affected template, field-data severity and business impact. Start with the device class and journeys where users actually experience the failure.
What do LCP, INP and CLS actually measure?
Each metric has three bands. Two boundaries matter: the "good" line you are aiming at, and the "poor" line that marks a page as broken rather than merely slow.
| Metric | What it measures | Good | Needs improvement | Poor |
|---|---|---|---|---|
| LCP (Largest Contentful Paint) | Time until the largest text block or image in the viewport renders | ≤ 2.5 s | 2.5–4.0 s | > 4.0 s |
| INP (Interaction to Next Paint) | Latency from an interaction until the next painted frame, represented by a high-percentile interaction for the page visit | ≤ 200 ms | 200–500 ms | > 500 ms |
| CLS (Cumulative Layout Shift) | Largest burst of unexpected layout movement in the page's life | ≤ 0.1 | 0.1–0.25 | > 0.25 |
Two details change how the numbers read. The assessment point is the 75th percentile of page loads, so three quarters of visits must be at or under the threshold — an average hides the failing quarter, the 75th percentile is designed not to. And mobile and desktop are segmented, so identical code can pass on desktop and fail on mobile: weaker CPUs and worse networks punish JavaScript far more than markup.
Alongside the three vitals sit diagnostics that are not scored but show where to look: Time to First Byte (TTFB) for server and network delay, First Contentful Paint (FCP) for render-blocking resources, and Total Blocking Time (TBT) as a lab proxy for interactivity.
Why does one PageSpeed Insights run prove nothing?
Because it is lab data, and lab data answers a different question. A PageSpeed report shows two things side by side, and the wrong one gets quoted.
| Field data | Lab data | |
|---|---|---|
| Source | Real Chrome users, real devices and networks | One simulated run on a fixed device and throttled network |
| Where you see it | Chrome User Experience Report, the field section of PageSpeed Insights, Search Console's Core Web Vitals report | Lighthouse, Chrome DevTools Performance panel, the lab section of PageSpeed Insights |
| Covers INP | Yes — real interactions | No — INP needs a user; TBT stands in for it |
| Use it for | Deciding whether a URL group passes | Finding the cause and testing a fix before release |
A lab score can swing between two consecutive runs on the same URL: simulated CPU and network vary, a cold cache differs from a warm one, third-party scripts respond differently minute to minute. Two further traps: field data is aggregated across groups of similar URLs, so the number shown for a low-traffic page is often describing its whole template, and field data lags, because it reflects visits that already happened. Ship the fix, confirm in the lab that the cause is gone, then wait for the field data to agree.
Glossary
- 75th percentile — the value three quarters of page loads are at or below; the point at which Core Web Vitals are assessed.
- CrUX (Chrome User Experience Report) — Google's public dataset of real-user performance measurements, and the source of field data in PageSpeed Insights and Search Console.
- Long task — a task occupying the main thread for more than 50 ms; a diagnostic signal that can contribute to interaction delay.
- Render-blocking resource — a stylesheet or synchronous script the browser must fetch and process before it can paint.
- LCP element — the element the browser judged largest in the viewport, usually a hero image, a heading, or a CSS background image.
- bfcache — the back/forward cache, an in-memory snapshot that makes back navigation instant and skips the shifts a fresh load repeats.
LCP: which quarter of the timeline owns the delay?
LCP is not one number but four in sequence: TTFB, resource load delay (the gap between the response arriving and the LCP resource starting to download), resource load duration (the download), and element render delay (from download complete to painted). Google's guidance for a well-balanced page puts roughly 40% in TTFB, roughly 40% in load duration, and under 10% in each delay. Read the split before touching anything — compressing an image will not fix a 1.2-second TTFB.
Causes that recur:
- The LCP resource is discovered late, because it is referenced from CSS or injected by JavaScript rather than present in the initial HTML.
- The hero image carries
loading="lazy", so the browser deprioritises an image that may define the metric. - Render-blocking stylesheets or synchronous
<script>tags in<head>hold up paint. - The image is oversized, uncompressed, or served in a legacy format.
- TTFB is inflated by redirect chains, uncacheable responses, or an origin far from the user with no CDN in front of it.
Fixes, roughly in order of payoff:
- Put the LCP candidate in the initial HTML and remove
loading="lazy"from it. Usefetchpriority="high"when the browser would otherwise prioritise the resource too late; do not assign high priority to several competing images. - Preload what the parser cannot see. If the hero comes from a CSS
background-image, or a font is only discovered after the stylesheet parses,<link rel="preload">closes the load-delay gap. - Reduce render blocking. Deliver critical styles early and defer non-critical resources where the implementation remains correct. Use
asyncordeferonly with an understanding of script dependencies and execution order. - Shrink the file. Modern formats (AVIF, WebP), correct dimensions for the breakpoint served, an image CDN, long
Cache-Controllifetimes. - Attack TTFB directly. Remove redirect hops, serve cached HTML from the edge, and stop appending unique query parameters that make every URL uncacheable.
- Serve content as HTML. Server-side rendering or prerendering removes the whole class of problem where main content only exists after a bundle executes.
Fonts belong here too: a web font that blocks text rendering delays a text LCP, so set font-display to something other than auto or block and preload the faces the first screen needs.
INP: what is holding the main thread when someone taps?
INP represents a high-latency interaction during the visit — usually the longest, with outlier adjustment on pages that contain many interactions. It has three phases: input delay (the wait before the handler can start), processing duration (the handler's work), and presentation delay (the wait for the next painted frame). The 200 ms good threshold covers the complete latency.
Any of the three phases can dominate. The main thread may already be occupied by script evaluation, a third-party tag or framework work; the event handler itself may do too much; or rendering and layout may delay the next frame. Profile an actual slow interaction rather than assuming which phase owns the time.
Causes that recur:
- Long tasks during and just after load: parsing, compiling and evaluating large bundles.
- Third-party scripts — tag managers, chat widgets, testing tools, analytics, consent tooling — executing at the moment someone first tries to interact.
- Layout thrashing: reading a layout property and writing a style in the same loop, forcing synchronous layout repeatedly.
- A very large DOM, which makes every style and layout recalculation more expensive.
- Rendering the page's HTML client-side without yielding, so the browser never gets a gap to respond in.
Fixes:
- Break long work into smaller tasks. Hand the main thread back between chunks so the browser can process input and paint.
scheduler.yield()can help where supported; provide a tested fallback and do not make critical functionality depend on an API without full browser support. - Do less on the main thread. Ship less JavaScript, defer what is not needed for the first interaction, and audit each third-party tag by asking what breaks if it loads two seconds later.
- Keep the handler minimal. Do the visible update, then defer the rest until after the frame is presented. Analytics calls and state syncing do not need to happen inside the click.
- Batch reads and writes so one frame does not force repeated synchronous layout.
- Reduce rendering cost. Flatten deeply nested DOM and use
content-visibilityso off-screen sections render lazily as they approach the viewport.
CLS: what is not reserving its space?
CLS counts unexpected movement of content that was already visible. Shifts within 500 ms of a user interaction are excluded, which is why an accordion opening is fine and an ad slot expanding on its own is not. One lever sits outside the table below: making the page eligible for bfcache, so back and forward navigation restores instantly instead of replaying the whole shifting load.
| Cause | What happens | Fix |
|---|---|---|
| Images without dimensions | The browser cannot reserve height until the file arrives, so everything below jumps | width and height attributes on <img> (browsers derive the aspect ratio from them), or CSS aspect-ratio, with width: 100%; height: auto for responsive scaling |
| Ads, embeds, iframes | A container sized by its content grows when the content arrives | Reserve space with min-height or aspect-ratio; keep late-loading slots low in the viewport |
| Dynamically injected content | Banners, notices and recommendation strips push the page down after paint | Fixed-size containers, or user-initiated loading instead of automatic insertion |
| Web fonts | The fallback face is swapped for a font with different metrics and text reflows | font-display: optional, a closely matched fallback stack, and size-adjust, ascent-override, descent-override, line-gap-override to align metrics; preload the critical face |
| Animations | Animating layout properties such as top or left can move content; effects such as box-shadow can also be expensive to paint |
Prefer transform and opacity for motion, and verify both layout stability and rendering cost |
Ad slots and consent interfaces deserve separate review because they are often introduced outside the main template workflow. An ad slot with no reserved height can shift the page when it fills. A consent interface injected after first paint may move visible content and execute JavaScript near the visitor's first interaction. Reserve predictable slot space where possible. If consent is presented as an overlay to avoid layout shift, it must still preserve keyboard access, visible focus, readable content and the legally required choice; performance cannot be improved by making the interface inaccessible.
Core Web Vitals and visibility in Google and AI answers
Google does not publish a separate Core Web Vitals threshold for AI Overviews or AI Mode. Its guidance applies the same technical requirements and fundamental SEO practices used in ordinary Search: content must be indexable and eligible to appear with a snippet, while no special AI schema or text file is required. A fast and stable destination improves the experience after a click, but passing Core Web Vitals does not by itself cause a citation.
For large sites, delivery reliability can also affect crawl capacity. Google documents that a site's crawl capacity can rise when responses and latency remain stable or improve and can fall with slower responses, server errors or rate limiting. That relationship should not be turned into a universal claim that every millisecond changes AI visibility. It means infrastructure, rendering and crawl access belong in the technical foundation, especially for large or frequently changing inventories.
In AI SEO, performance therefore sits inside the technical foundation alongside crawl access, rendering and indexing. Entity accuracy and useful, well-supported content remain separate requirements. For the wider picture, see the AI SEO pillar; for source selection, see AI Overviews and GEO.
Keep the ranking question in proportion. Google states that Core Web Vitals are used by its ranking systems and also that good scores do not guarantee top rankings, because relevance remains primary. Google does not publish a simple weight or promise that a passing page will outrank a failing one. Improve performance for users and treat its ranking contribution as one part of a broader system, not as a substitute for useful content.
Which fixes should go first?
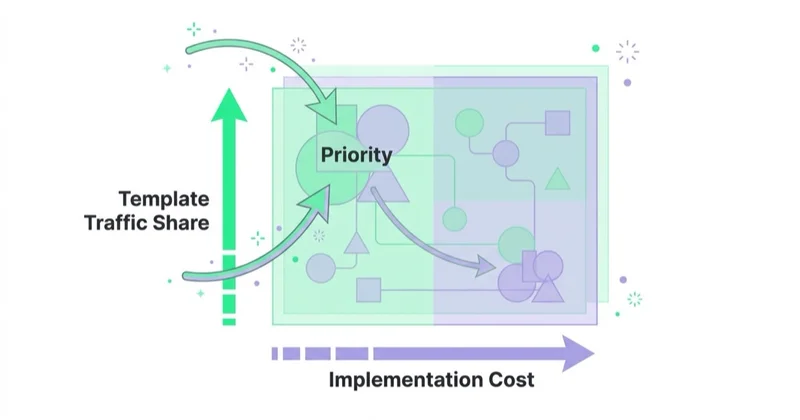
Search Console groups URLs with similar performance characteristics, and shared templates often create shared causes. One product-template fix can therefore affect many URLs, but page-specific media, third-party embeds, traffic mix and server behaviour can still make individual cases differ. Use the group to find scale, then verify representative URLs.
| Priority | What it is | Why here |
|---|---|---|
| 1 | The template carrying the most sessions, on mobile | Most affected visits per unit of work, and mobile is where thresholds are missed |
| 2 | Templates receiving paid traffic | You pay for every visit, and the delay sits between the click and the page |
| 3 | URL groups in the "poor" band on important journeys | The user impact is severe; implementation cost still needs diagnosis |
| 4 | Site-wide causes: a blocking tag, a font, a global banner | One change, every template |
| 5 | Individual high-value pages | Worth doing, after the template-level work |
Two sanity rules. Fix causes, not scores — the same score can come from a slow server or an oversized image, and only one is fixed by touching the image. And put the business number next to the vital: if a template's LCP improves and add-to-cart or form-start rate does not move, the bottleneck was elsewhere, which is information rather than failure.
How Space Ads approaches this
At Space Ads, the performance workflow starts with field data: Search Console and CrUX to identify affected URL groups, device classes and real-user metrics. We then reproduce representative pages and interactions in PageSpeed Insights and Chrome DevTools, split LCP into subparts, inspect main-thread activity around slow interactions and identify layout-shift sources.
The deliverable is a prioritised implementation backlog. Each item names the affected template or component, evidence, metric phase, expected technical change, implementation dependency and verification method. Site-wide scripts, fonts and consent components are reviewed separately because one change can affect many templates. This backlog can feed the same delivery process as a UX audit, while field-data confirmation remains distinct from immediate lab verification.
Action plan
- Read the field data first. Search Console's Core Web Vitals report: which URL groups fail, which metric, mobile or desktop. Write down groups, not pages.
- Identify the template behind each failing group, plus its share of sessions and revenue. That ordering is the plan.
- Find the cause in the lab. For LCP, the subpart breakdown. For INP, a recorded interaction in the Performance panel to find the long task. For CLS, the layout-shift regions overlay.
- Fix site-wide causes first — render-blocking stylesheet, blocking third-party tag, font loading, consent layer. These land on every template at once.
- Then fix the top template: LCP element, then the interaction path, then reserved space.
- Verify in the lab before release. The subpart that owned the time should be visibly smaller, and no new long task should appear.
- Add a regression guard — a performance budget in CI, or a monitored real-user metric — so the next feature does not quietly undo the work.
- Re-read the field data after the window turns over and compare the template's business metric next to the vital.
Common mistakes
| Mistake | What to do instead |
|---|---|
| Quoting one Lighthouse score as the site's performance | Judge with field data at the 75th percentile per URL group; use lab runs to find causes |
| Compressing images when TTFB owns the time | Read the LCP subpart breakdown before choosing a fix |
Leaving loading="lazy" on the hero image |
Remove lazy loading from any LCP candidate and set fetchpriority="high" |
| Treating INP as a load-time problem | Profile a real interaction; the usual owner is a long task from a bundle or a third-party tag |
| Reserving no space for ads, embeds and banners | Set min-height or aspect-ratio in server-rendered CSS, and render consent as an overlay |
| Chasing a green score on a page with no traffic | Order the backlog by template and traffic share, mobile first |
FAQ
What are Core Web Vitals?
Core Web Vitals are three metrics Google uses to describe page experience: Largest Contentful Paint (LCP) for loading performance, Interaction to Next Paint (INP) for responsiveness, and Cumulative Layout Shift (CLS) for visual stability. They are assessed on real-user field data at the 75th percentile of page loads, segmented across mobile and desktop.
Why does PageSpeed Insights give a different result every time?
The lab section runs a single simulated load with throttled CPU and network, so cache state, third-party response times and simulation variance change the result between runs. The field section, sourced from real users in the Chrome User Experience Report, is the part that reflects how the page actually performs.
Are Core Web Vitals a ranking factor?
Google states that Core Web Vitals are used by its ranking systems, and in the same documentation that good scores do not guarantee top rankings, because Search still aims to show the most relevant content even when page experience is sub-par. In practice, page experience differentiates between pages with comparably useful content.
How long does it take for Core Web Vitals to improve after a fix?
The cause disappears from lab measurement as soon as the fix ships, but field data is aggregated over recent visits, so the reported vitals only move once enough post-fix visits accumulate. Verify the cause in the lab immediately and treat the field number as delayed confirmation.
Do Core Web Vitals affect visibility in AI search?
Google does not publish a separate Core Web Vitals threshold for AI Overviews or AI Mode. The same technical requirements and fundamental SEO practices apply. Performance supports user experience and, on large sites, stable delivery can support crawl capacity, but a good score does not guarantee that a page will be selected or cited.
What is the difference between INP and the older FID metric?
INP replaced First Input Delay as the responsiveness Core Web Vital. FID measured only the delay before the first interaction's handler began running. INP observes interactions across the visit and measures their full latency, including processing and the wait for the next painted frame, while adjusting the selected high-latency value on pages with many interactions.
Sources and further reading
- web.dev — Web Vitals: thresholds, 75th percentile, field vs lab.
- web.dev — Optimize Largest Contentful Paint: subparts and fixes.
- web.dev — Optimize Interaction to Next Paint and Optimize long tasks: yielding,
scheduler.yield(), the 50 ms threshold. - web.dev — Optimize Cumulative Layout Shift: reserved space, fonts, animations, bfcache.
- Google Search Central — Understanding page experience in Google Search results.
- Google Search Central — Optimizing your website for generative AI features on Google Search.
- Google Search Central — Managing crawl budget for large sites.
Continue learning
- AI SEO: How to Optimize for Search Engines, AI Overviews and LLMs
- What Is an SEO Audit and How to Do It Properly?
- AI Overviews and GEO: How to Increase the Chance AI Cites Your Brand
- How to Use Google Search Console for SEO
- AI SEO · UX audit
In short
- Core Web Vitals are LCP (≤ 2.5 s), INP (≤ 200 ms) and CLS (≤ 0.1), judged on real-user field data at the 75th percentile and segmented by device class.
- Field data decides whether a URL group passes; lab data finds causes and tests fixes. One lab run is evidence about that run only.
- LCP has four subparts and INP has three phases — read the breakdown first, or the work lands on the wrong part of the timeline.
- Common CLS causes include missing image dimensions, unreserved ad or embed slots, injected banners, font metric changes and layout-triggering motion.
- Review third-party scripts and consent components early because they can affect both responsiveness and layout stability across templates.
- Prioritise by field-data severity, affected template, device class, user volume and business importance; verify representative URLs rather than assuming every page behaves identically.
- Google defines no separate Core Web Vitals threshold for generative Search features; performance remains part of the broader technical and user-experience foundation.
Continue reading

Schema Markup: Which Structured Data Types Actually Do Something
Useful schema markup starts with the page and a supported outcome, not a universal checklist. Learn when WebSite, Organization, Product, Article, breadcrumbs and LocalBusiness are worth implementing — and when markup only adds maintenance.

llms.txt: What the File Does and What It Cannot Do
llms.txt is an index for language models — not a crawler control and not a ranking factor. This is what the format specifies, who reads it today, and how to keep it from going stale.

AI Crawlers: GPTBot, ClaudeBot, PerplexityBot and What to Allow
AI crawlers can support model training, search retrieval or a fetch initiated by a user. This guide maps documented user-agent tokens to their purpose, explains what robots.txt can and cannot control, and shows how to create a defensible policy.


































