
“What is a good cost per lead in our industry?” There is no reliable universal answer. A £20 form submission may be unusable; a £600 verified enquiry may be attractive when contribution margin and sales conversion support it.
Cost per lead (CPL) remains a useful operating metric, but only when its numerator, denominator and time window are explicit. A benchmark cannot know your lead definition, full acquisition cost, margin, sales capacity or retention.
This guide shows how to interpret published benchmarks, distinguish media CPL from fully loaded CPQL and CAC, calculate an internal affordability threshold, and diagnose a change without trading quality for cheap volume.
TL;DR
- State what counts as a lead, which costs are included, the source of truth and the cohort window every time you report CPL.
- Media CPL divides advertising spend by attributed leads. A fully loaded CPL can include creative, agency, technology, validation and allocated operational cost.
- A submission, valid lead, qualified lead, opportunity and customer are separate stages. Calculate cost and conversion at each stage.
- Benchmarks are comparable only when stage, channel, market, period, attribution and cost scope are sufficiently similar.
- Derive an internal CPL threshold from target CAC and observed lead-to-customer conversion, using the same cost scope on both sides.
- A CPL below the modelled threshold is not proof of profitability. Margin, attribution, retention and cost assumptions still need validation.
- Optimise for qualified business outcomes and sustainable volume, not the lowest possible form cost.
What is cost per lead (CPL)?
The general formula is:
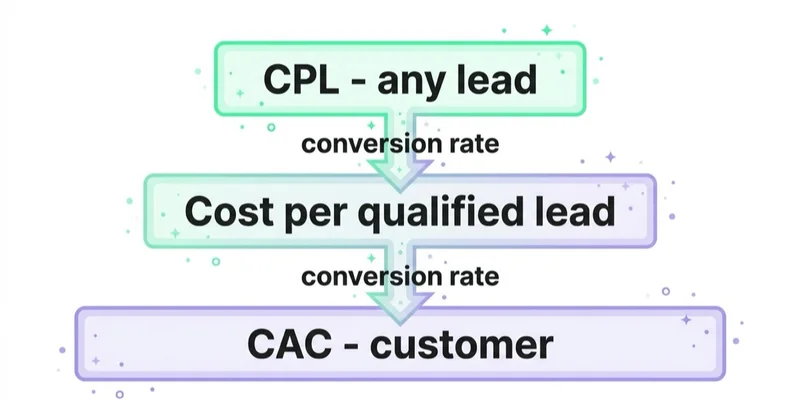
CPL = acquisition cost in scope / leads that meet the stated definition
If a campaign spends £12,000 and records 240 form submissions, media CPL is £50. That number does not reveal whether the submissions were valid, unique, serviceable or qualified, nor what it cost to process them.
Every CPL report should therefore include:
- lead definition: form submit, answered call, valid enquiry, MQL or another explicit event;
- cost scope: media only or a fully loaded programme cost;
- date logic: when spend occurred and which acquisition cohort outcomes belong to;
- source of truth: ad platform, analytics, CRM or an agreed reconciliation;
- validity rules: treatment of spam, tests, duplicates, existing customers and wrong markets;
- attribution rule: how credit is assigned when several interactions contributed.
Media CPL vs fully loaded CPL
Media CPL is useful for campaign operations:
media CPL = attributed media spend / attributed leads
Fully loaded CPL is more useful for programme economics:
fully loaded CPL = (media + creative + technology + agency + validation + allocated operations) / valid leads
The exact cost scope depends on the decision. Do not place both figures in one trend without labelling them.
CPL vs CPQL vs CAC — the distinction that matters
These three get mixed up constantly, and the confusion causes bad decisions.
| Metric | What it measures | When you use it |
|---|---|---|
| CPL | A lead under a stated definition | Acquisition efficiency at that stage |
| CPQL | A lead meeting agreed qualification criteria | Cost of reaching contacts eligible for the next process |
| Cost per opportunity | An opportunity accepted into the sales pipeline | Economics at the start of an active sales process |
| CAC | A new customer | Acquisition cost across the agreed marketing and sales scope |
CPQL is:
CPQL = cost in scope / qualified leads
Suppose 240 submissions produce 60 valid leads and 24 qualified leads. The media campaign still has one form CPL, but the cost per valid and qualified lead is very different. Stage conversion rates reveal whether a change came from capture, data validity, qualification or later sales performance.
If CAC worsens while raw CPL is stable, do not automatically blame sales. Traffic mix, offer, qualification, product mix, reporting lag or sales capacity may have changed. Diagnose the full path. Our guide to customer acquisition cost benchmarks covers CAC, value and payback in more detail.
Why "average CPL by industry" misleads
Before using an industry table, ask:
- Does the source disclose sample size, dates and methodology?
- What event is called a lead?
- Does cost mean media spend or fully loaded acquisition cost?
- Are channel, country, device, sales model and offer value comparable?
- Is the number a mean, median, range or spend-weighted result?
- Are invalid leads and duplicates removed?
- Does the dataset combine brand and non-brand demand?
Industry labels hide major variation. “Legal” may combine consumer enquiries with enterprise retainers. “SaaS” may combine self-serve trials with sales-qualified enterprise accounts. Even a well-documented benchmark cannot account for your margin, retention, close rate and capacity.
Use a benchmark as a prompt for investigation, not as a target or proof that a campaign is profitable. Your strongest benchmark is usually a stable internal cohort under an unchanged definition.
How to calculate your maximum sustainable CPL
1. Estimate customer contribution
Start with revenue over a defensible period and subtract variable delivery costs. Do not use an optimistic lifetime value when retention history is limited or cash must pay back much sooner.
2. Set a target CAC
Target CAC must leave room for fixed cost, risk, required profit and cash-flow constraints. It is a finance and growth decision, not a platform default.
3. Measure conversion on a mature acquisition cohort
If 8 of 100 valid leads become customers, lead-to-customer conversion is 8%. Leads acquired last week may be too young when the sales cycle lasts months.
4. Convert target CAC into a stage threshold
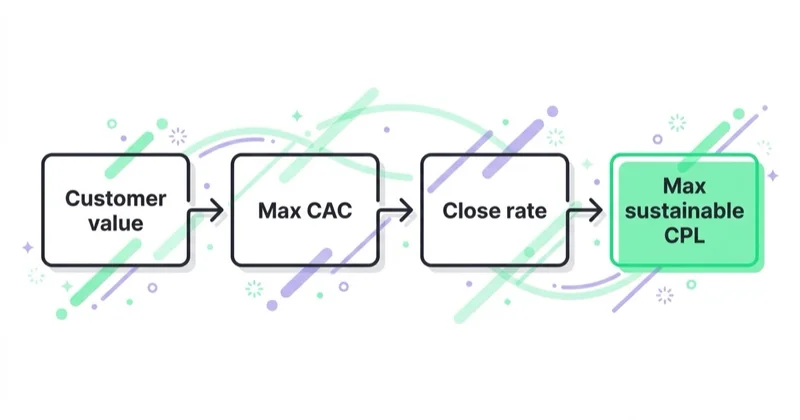
maximum fully loaded CPL = target CAC × lead-to-customer conversion rate
If target CAC is £1,500 and 8% of valid leads become customers, the modelled maximum fully loaded cost per valid lead is £120.
To derive a media CPL threshold, first remove from the target acquisition budget the per-customer amounts for creative, agency, technology, qualification and sales that are included in CAC. Then multiply the remaining media allowance by lead-to-customer conversion. Otherwise, you compare media CPL with fully loaded CAC and overstate the budget available for ads.
The result is a planning threshold, not a guarantee. Validate margin, attribution, retention and segment mix against finance data. Show conservative, base and upside scenarios when inputs remain uncertain.
Analyse cohorts, not mismatched calendar periods
Group leads by acquisition date and allow the cohort to mature. Customers won this month may have originated from spend several months ago; dividing them into this month's spend creates a misleading CAC and CPL relationship.
Segment the report by source, campaign, offer, landing page, geography, product and lead type where sample size permits. Show the number of observations and avoid decisive claims based on one sale or a handful of leads.
Track stage timestamps as well as final status. They reveal whether rising cost reflects slower qualification, sales backlog or a genuine quality change.
What drives CPL up or down
- Auction and reach cost: competition, season, channel and format affect the cost of traffic or impressions.
- Intent and segment mix: one campaign can combine audiences with very different likelihoods of progressing.
- Offer and message: a relevant proposition may improve response, while an overbroad incentive may create cheap low-fit submissions.
- Form or page experience: speed, clarity, device, questions and trust affect completion.
- Definition and validation: removing spam or tightening criteria can raise reported CPL while improving the usefulness of the result.
- Measurement: duplicate tags, consent state, attribution windows or offline imports can change the report without changing demand.
- Scale: incremental volume may require broader audiences or more expensive auctions; cost does not always scale linearly.
How to reduce CPL without buying junk
- Audit measurement. Separate stages, deduplicate conversions and reconcile platform data with CRM outcomes.
- Analyse rejection reasons. Spam, wrong geography, no fit and no contact require different remedies.
- Remove irrelevant demand. Review search terms, placements, audiences, locations and exclusions appropriate to the channel.
- Align message and offer. Ad, page and form should address the same problem and identify the appropriate customer.
- Test the experience. Remove unnecessary fields and technical friction, but assess variants on validity and qualification as well as conversion rate.
- Return deeper outcomes. Google Ads supports separate qualified and converted lead actions, offline imports and conversion values. Implement them only with stable definitions, sufficient data and compliant data handling.
- Improve post-lead operations. Routing, response, status discipline and sales capacity can change customers won without changing media CPL.
Not every improvement lowers raw CPL. A change that raises form CPL while reducing CPQL and CAC is an economic improvement.
How to manage CPL with an agency
The scope should define conversion stages, data sources, CRM ownership, validation, reporting cadence and the financial threshold. An agency report should not stop at average CPL when reliable qualified-lead and customer outcomes are available.
Establish a baseline, identify the constraint and run a specific test across traffic, offer, page, qualification, measurement or follow-up. Judge the result on CPL, CPQL, volume and downstream economics. That is how lead generation becomes a measurable system rather than a form-delivery service.
Common questions
What is a good cost per lead? One that, under a clear definition and cost scope, supports target CAC, contribution margin and payback at the observed conversion rate. It must be assessed with quality and volume, not in isolation.
Is CPL the same as CAC? No. CPL measures a lead stage; CAC measures an acquired customer. With the same cost scope, CAC can be approximated as CPL divided by lead-to-customer conversion, but fully loaded CAC normally includes more than media.
Should we target the lowest CPL? Not automatically. A low CPL can come from an easier but less valuable conversion. Compare valid-lead rate, CPQL, cost per sales opportunity, CAC, margin and scalable volume.
How do we calculate maximum CPL? Multiply target CAC by the conversion rate from that lead definition to customer, using a mature cohort and the same cost scope. For a media-only target, deduct other acquisition costs first.
Are CPL benchmarks useful? They provide context only when methodology, lead stage, channel, geography, period and cost scope are comparable. Internal economics and mature cohort performance are more useful for budgeting.
Why did CPL rise without a campaign change? Auction cost, seasonality, traffic mix, page behaviour, measurement, small samples or lead validation may have changed. Decompose the result into reach cost, conversion and downstream quality before acting.
Sources
- Google Ads — About conversion measurement
- Google Ads — Qualified and converted leads
- Google Ads — Offline conversion imports
- Google Ads — Conversion values
- Google Ads — Return on investment
Continue learning
Continue reading
Performance-Based Marketing and Pay-Per-Lead: How It Works
Pay-per-lead can align payment with a defined outcome, but it does not remove business risk. Learn how to define a billable lead, calculate a sustainable CPL, connect CRM outcomes and protect quality, data and compliance.
How to Choose a Lead Generation Agency (Questions to Ask, Red Flags)
A practical framework for comparing lead generation agencies: scope, measurement, pricing, account ownership, security, contracts and the questions worth asking before you sign.
Speed to Lead: Why Response Time Decides Who Wins the Deal
Learn how to measure and improve lead response time without sacrificing quality: define the right timestamps, set channel-specific targets, fix routing and coverage, and validate the impact on sales outcomes.


































