
Meta ads benchmarks summarise results from a particular set of advertisers, dates, countries, objectives, placements, attribution settings, and metric definitions. Without that methodology, an “industry average” cannot tell you whether an account is healthy.
Use external figures to frame questions, then build an internal baseline by business goal and comparable campaign conditions. The decision metric should reflect economics—incremental contribution, qualified customers, or another appropriate outcome—not simply whichever platform ratio looks strongest.
TL;DR
- Methodology comes first. Require source, dates, sample, market, objective, performance goal, placement, and attribution window.
- Meta's auction is not price competition alone. Meta says total value includes bid, estimated action rate, and ad quality.
- CTR is a diagnostic, not a universal quality score. Define link CTR versus all-click CTR and connect it to landing-page views and qualified outcomes.
- CPC follows CPM and CTR mathematically. If CTR is expressed as a percentage, link CPC is approximately CPM ÷ (10 × link CTR%), assuming aligned impressions and link clicks.
- ROAS is revenue divided by ad spend. It excludes margin by definition and depends on attribution, revenue capture, returns, and purchase mix.
- Objective and performance goal change delivery. Compare campaigns optimised for the same result, not merely the same industry.
- Internal trends are not automatically causal. Annotate changes and use experiments or lift studies for important incrementality questions.
Why a single Meta benchmark is nearly useless
The same headline metric can describe different events. “CTR” may mean all clicks or link clicks; “CPC” may use the same distinction; “conversion” may refer to a lead, purchase, or custom event. A seven-day click and one-day view attribution setting is not comparable to click-only reporting, and a traffic campaign is selected for a different action than a sales campaign.
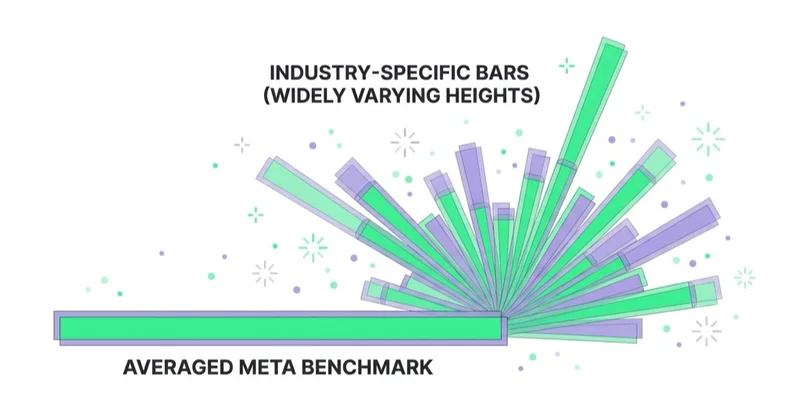
An external number is useful only when it prompts a specific check: placement mix, audience, objective, bid strategy, creative, measurement, or season. Your own history is more comparable, but it can still move because of customer demand, promotions, site changes, inventory, tracking, or budget. Keep an annotated baseline and compare similar periods.
What moves each metric
Understanding what drives each benchmark is more useful than the number itself, because it tells you what you can and can't control.
| Metric | Mostly driven by | How controllable |
|---|---|---|
| CPM (cost per 1,000 impressions) | Auction outcome, objective, performance goal, audience, placements, bid, estimated action rate, quality, period | Influenced by setup and creative, but not controlled directly |
| Link CTR | Link clicks ÷ impressions | Influenced by message, creative, audience, placement, and click definition |
| Link CPC | Spend ÷ link clicks | Mathematical result of CPM and link CTR for aligned data |
| Post-click CVR | Purchases or qualified actions ÷ landing-page sessions/clicks | Offer, site, traffic quality, measurement, and conversion delay |
| CPA | Spend ÷ attributed results | All upstream rates plus result definition and attribution |
| ROAS | Attributed revenue ÷ ad spend | Revenue mix and attribution; excludes margin and other costs |
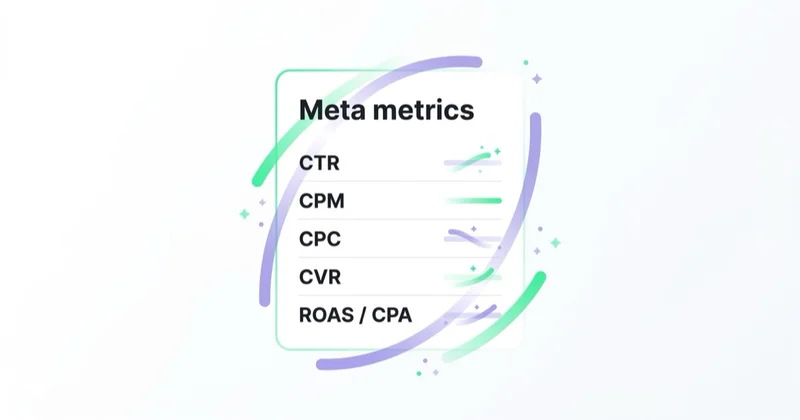
The relationships help locate a change. For aligned link metrics, CPC ≈ CPM ÷ (10 × CTR%). Revenue per impression can then change through click rate, post-click conversion, and average order value. Margin does not enter the ROAS formula; it enters the decision about whether that ROAS is commercially sufficient. Diagnosing a dropping ROAS therefore means decomposing the path and validating measurement.
CPM: an auction outcome, not a grade
Meta explains that its ad auction uses the advertiser bid, estimated action rate, and ad quality to calculate total value. Campaign objective, performance goal, audience, placements, budget, duration, and creative all shape eligibility and delivery. Advertiser demand and available inventory also change over time.
A higher CPM is not automatically bad. A campaign may reach a smaller but more valuable audience or shift into placements that convert better. Conversely, a low CPM can buy impressions that produce little business value. When CPM changes, inspect placement, reach, frequency, audience, objective, performance goal, bids, creative, and the downstream funnel before editing the account.
Glossary
- CPM — spend divided by impressions, multiplied by 1,000.
- CPC — spend divided by the selected click type; specify all clicks or link clicks.
- CTR — the selected click type divided by impressions; specify the numerator.
- CVR — conversions divided by a defined denominator such as landing-page sessions or clicks.
- ROAS — attributed conversion value or revenue divided by ad spend; it does not include margin.
- Blended vs in-platform — all revenue/spend vs Meta's own reported ROAS.
- Objective — the top-level campaign goal, such as awareness, traffic, leads, app promotion, engagement, or sales; it shapes eligible performance goals and delivery.
ROAS benchmarks: the most misleading of all
ROAS cannot be judged without contribution margin, variable costs, returns, new-versus-returning mix, and payback policy. A 3× ratio may be viable for one business and unprofitable for another. It also changes with Meta's attribution setting, event matching, purchase-value quality, and whether reports include view-through conversions.
In-platform attribution can over- or understate causal effect; the direction is not knowable from the dashboard alone. A blended revenue-to-spend ratio removes channel credit disputes but still is not incremental and can move with organic demand. Use it as one business-level view alongside contribution, cohorts, experiments, and the framework in MER vs ROAS.
Objective and season change everything
Two variables invalidate many cross-account comparisons. Objective and performance goal tell Meta which action to seek. Meta's awareness objective can optimise for reach, impressions, ad recall lift, or video views; traffic can optimise for link clicks or landing-page views; sales can optimise for conversion actions or value. Objective names alone may still be too broad for comparison.
Period and market conditions can change advertiser demand, inventory, customer intent, promotions, and conversion rate. Meta notes that major holidays or sporting events can make audience reach more expensive, but this is not a universal Q4 rule. Compare equivalent weeks, annotate events, and separate auction movement from site or offer changes.
How Space Ads approaches Meta benchmarks
At Space Ads, a benchmark record includes metric definition, objective, performance goal, conversion location, attribution setting, market, audience type, placement mix, budget range, and period. We reconcile Meta events and values with the commerce or CRM source before interpreting CPA or ROAS.
Analysis decomposes CPM, link CTR, landing-page rate, post-click conversion, AOV, returns, and contribution. The internal baseline is annotated for campaign, offer, site, tracking, and stock changes. Where the decision warrants it and eligibility permits, experiments or lift studies provide stronger evidence than trend comparison. This lives in Meta Ads and performance marketing.
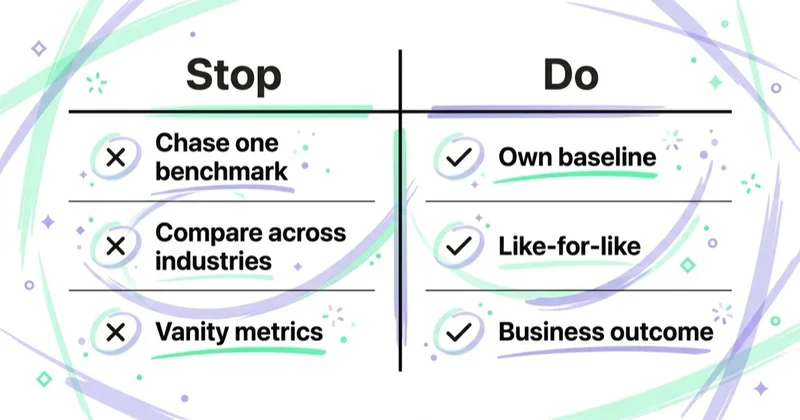
Stop doing / Do instead
| Stop doing | Do instead |
|---|---|
| Judging your account against a single Meta average | Trend your own baseline, segmented by objective and season |
| Reading a CPM rise as an account failure | Inspect objective, placements, audience, auction context, and downstream value |
| Benchmarking ROAS across industries | Define the viable ratio from contribution, returns, and payback |
| Treating either platform or blended ROAS as causal | Use attribution operationally and incrementality evidence for causal claims |
| Comparing metrics across campaign objectives | Align objective, performance goal, conversion location, attribution, and placement context |
| Treating a high CPC as one problem | Decompose: is it CPM (auction) or CTR (creative)? |
Common mistakes
Common errors include mixing all-click and link metrics, comparing different attribution windows, ignoring performance goal and placement, treating low CPM or high CTR as success without qualified outcomes, and reading ROAS without returns or contribution. Another is comparing pre- and post-promotion periods without accounting for demand, offer, site, and budget changes.
FAQ
What is a good CPM on Facebook/Meta ads?
There is no universal good CPM. Compare the same objective, performance goal, audience, market, placement mix, and period, then evaluate what the impressions produce. Meta's auction considers bid, estimated action rate, and ad quality; demand and inventory also vary.
What is a good CTR for Facebook ads?
Specify link CTR or all-click CTR first. Compare like-for-like placements and objectives, then connect the rate to landing-page views, qualified sessions, conversions, and customer quality. A higher CTR can indicate stronger relevance, but it can also attract low-intent or accidental clicks.
Are Meta ROAS benchmarks reliable?
They are rarely comparable without attribution, event-value, market, product mix, and customer-mix details. ROAS excludes margin, so derive the commercially required level from contribution economics and payback. Use platform and blended views for different operational questions, and experiments for causal effect where possible.
Why is my Meta CPM so high?
Check whether objective, performance goal, audience, placements, budget, bid strategy, creative, reach, frequency, or period changed. Auction demand may be part of the explanation, but a high CPM is not automatically a problem if downstream value improved. Diagnose the full path before editing.
How do I benchmark my Meta ads properly?
Define the metrics and business outcome, then compare the same objective, performance goal, attribution setting, market, audience, placement, and period. Reconcile platform values with backend data, annotate changes, and use external data only when its methodology matches. Judge against contribution and incremental effect, not an isolated average.
Does campaign objective affect the benchmarks?
Yes. Meta's system looks for people likely to take the action associated with the selected objective and performance goal. Compare the same optimisation outcome, not just the same industry or even the same top-level objective.
Key takeaways
- External Meta benchmarks require comparable definitions, objective, performance goal, placement, market, attribution, and period.
- Meta's auction uses bid, estimated action rate, and ad quality; CPM is an outcome, not an account grade.
- For aligned data, CPC reflects CPM and CTR mathematically; diagnose both before acting.
- ROAS is attributed revenue divided by spend and excludes margin, returns, and other variable costs.
- Use an annotated internal baseline for operations and experiments or lift studies for important causal questions.
Sources and further reading
- Meta for Business — The ad auction explained
- Facebook Help Center — How Meta's ad auction uses machine learning
- Meta for Business — Campaign objectives and performance goals
- Facebook Help Center — How CPM is calculated
Continue learning
Continue reading

Why Your Meta Ads Stopped Working (and How to Diagnose It)
When Meta performance changes, diagnose the affected layer before editing campaigns. This guide covers delivery status, billing, event quality, funnel metrics, activity history, creative, offer, website and controlled recovery.

Scaling Meta Ads Without Killing ROAS
Scaling Meta ads is a commercial decision, not a promise to preserve the same ROAS at a higher spend. Learn how to set a profitable ceiling, diagnose constraints and increase budget through controlled tests.
Reach vs Impressions vs CPM: What Each Metric Means and What to Buy On
Reach estimates unique exposure, impressions count delivery events, and CPM expresses cost per thousand impressions. This guide explains their limits, viewability, frequency distribution and how to match buying and measurement to the campaign goal.


































