
ROAS is attributed revenue divided by ad spend. When it falls, at least one part of that ratio—or its measurement—changed. The cause may be higher media cost, lower conversion, lower order value, a different customer mix, conversion delay or a tracking/configuration change.

Do not respond with a universal "cut" or "keep spending" rule. Protect cash and customers first, then compare mature, consistently defined data and isolate the driver. Some cases have one clear cause; others are the combined effect of several smaller changes.
TL;DR
- Apply guardrails immediately. Pause only clear waste, broken destinations, invalid offers or spend beyond cash, stock and loss limits.
- Compare like with like. Use the same ROAS definition, attribution window, conversion status, currency, time zone and mature conversion cohort.
- Account for conversion lag. Recent ROAS can look artificially low while conversions are still arriving.
- Decompose the ratio. For click-led journeys, investigate cost per click, conversion rate and order value; add view-through and offline paths where relevant.
- Segment before explaining. Find the market, campaign, product, device, new/returning customer or funnel stage driving the change.
- Use MER as context, not proof. Total revenue divided by spend cannot identify which channel caused a movement.
- Close with a test and owner. State the hypothesis, action, guardrails, observation window and rollback condition.
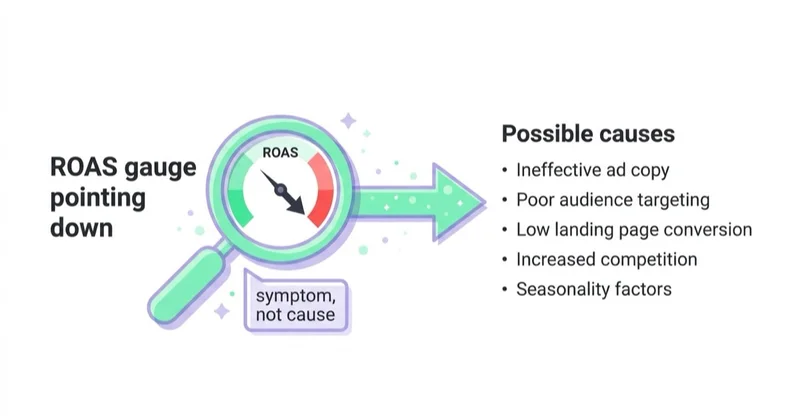
ROAS is a symptom — diagnose before you cut
ROAS combines commercial performance and attribution. It does not show margin, cash collection, refunds, repeat purchases or incrementality unless the reporting model explicitly includes them. A fall may be commercially acceptable if new-customer contribution remains above target; a high ROAS may still be unprofitable on low-margin products.
Before a full diagnosis, check immediate risk:
- destination unavailable, incorrect price or broken checkout;
- uncontrolled spend or bid change;
- out-of-stock products still promoted;
- policy, brand-safety or customer-harm issue;
- daily loss, cash or fulfilment guardrail breached.
Pause or cap the affected scope when a guardrail is breached. Otherwise preserve enough stability to diagnose. The goal is not to protect campaign learning at any cost; it is to avoid compounding loss while retaining evidence.
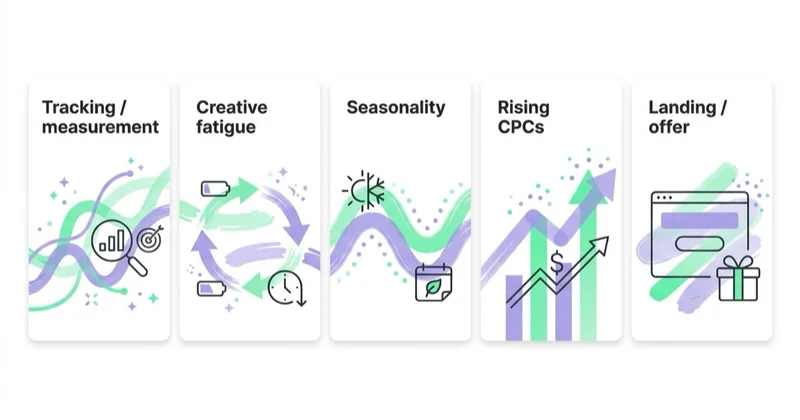
Suspect 1: measurement
First make the comparison valid. Record:
- numerator: gross revenue, net revenue, conversion value or predicted value;
- denominator: media spend only or a wider cost basis;
- conversion actions, count settings and primary/secondary status;
- order statuses, cancellations, refunds, taxes and shipping;
- attribution model, click/view window and reporting date basis;
- currency, time zone, market and comparison period.
Then check change history and diagnostics. Website releases, consent changes, tag edits, catalog changes, CRM imports and attribution settings can alter reporting. Google Ads documents that conversion reporting may lag and that differences with Analytics can arise from counting, windows, click-versus-session logic and other settings even when tracking works.
Compare mature cohorts. Google Ads conversion-lag reporting exists because recent CPA can look inflated and ROAS deflated while later conversions have not arrived. GA4 data and attribution credit can also change after initial reporting. Do not compare today's incomplete result with a fully matured historical period.
Validate representative transactions end to end: browser event, server event where used, deduplication, value, currency, order ID, consent path and downstream status. This is also the first step in diagnosing a Meta performance drop.
Suspect 2: blended vs in-platform
Platform ROAS and blended revenue-to-spend ratios answer different questions. Platform ROAS credits eligible conversions under that platform's rules. MER or blended ROAS compares defined total revenue with defined total media spend.
If platform ROAS falls while MER holds, possible explanations include attribution change, stronger organic or other paid channels, a promotion, returning-customer demand or timing. It does not prove the affected platform remained effective. Conversely, falling MER may reflect product availability, price, refunds or offline demand rather than media alone.
Reconcile platform, analytics, commerce/CRM and finance totals; document the expected gap. Use incrementality experiments when the decision requires causal evidence. See MER vs ROAS.
Suspect 3: scaling into diminishing returns
When spend increases, diminishing marginal returns are common because the campaign may enter additional auctions or reach lower-propensity demand. But coincidence is not proof: a promotion may end, inventory may change or conversion reporting may still be immature.
Estimate the incremental result over a stable baseline and compare additional contribution—not only revenue—with the allowable acquisition cost. A budget experiment, geo test or other controlled design is stronger than comparing two adjacent periods. If additional spend misses the guardrail, hold or reverse the change while investigating whether creative coverage, audience eligibility, offer, inventory or conversion is the constraint. See scaling Meta ads without killing ROAS.
Glossary
- ROAS — return on ad spend; revenue attributed to ads ÷ ad spend.
- Blended ROAS / MER — defined total revenue divided by defined media spend; useful context, not causal attribution.
- Marginal ROAS — the change in revenue associated with a change in spend; best interpreted with incremental contribution and a credible test.
- Conversion lag — time between ad interaction and conversion/reporting, which makes recent periods incomplete.
- AOV — average order value; a drop lowers ROAS at constant spend and conversion.
- Conversion rate — share of sessions that buy; a site-side drop shows up as falling ROAS.
Decompose ROAS into operational drivers
For a click-led ecommerce journey, a simplified relationship is:
ROAS ≈ (conversion rate × average order value) ÷ cost per click
This is a diagnostic identity, not a complete attribution model. View-through, assisted, app, store and offline journeys require additional treatment. Still, it directs the investigation:
- Cost per click rose: inspect CPM, click-through rate, placement, audience, bid strategy, query mix and geography.
- Conversion rate fell: inspect traffic mix, landing relevance, device, page errors, stock, delivery promise, checkout and payment.
- Average order value fell: inspect product mix, discounting, bundles, currency, taxes and new/returning customer mix.
- Attributed value fell without order change: inspect event values, attribution settings, consent, imports, deduplication and reporting maturity.
Do not infer creative fatigue from frequency or a falling CTR alone. Compare concepts, delivery concentration, new-reach indicators and downstream outcomes, then test a replacement. Do not label higher CPM "competition" without evidence; auction cost also changes with audience, placement, quality, season and bid settings.
Seasonality requires an appropriate baseline: comparable weekdays, holidays, promotions, stock and prior-year market conditions. "It happens every January" is a hypothesis, not a diagnosis.
Segment until the change has an owner
An account average can hide one concentrated problem. Create a contribution-to-change view by:
- market, currency and region;
- campaign, objective and conversion action;
- new versus returning customer;
- product, category, margin tier and stock status;
- device, browser, landing page and checkout method;
- creative concept and placement;
- day, hour and promotion period;
- lead stage or order status.
Look for the segment that explains most of the absolute revenue or cost change, not simply the worst percentage on tiny volume. Then connect it to the change log: price, offer, feed, page release, shipping threshold, creative, audience, budget, bid, consent or sales process.
Aggregate website conversion rate is partly determined by traffic mix. A lower rate does not prove the site worsened, and stable conversion does not rule out a severe issue in one device or product. Test the actual path and compare like-for-like segments.
Turn the diagnosis into a controlled response
For each plausible cause, write:
- evidence supporting and contradicting it;
- the smallest safe test or fix;
- owner and implementation date;
- business guardrail and rollback condition;
- observation window based on conversion lag;
- outcome that would confirm, reject or leave the hypothesis unresolved.
Some defects—broken checkout, wrong value or invalid offer—should be fixed immediately rather than A/B tested. For uncertain optimisation choices, change one major variable at a time where practical.
How Space Ads approaches a falling ROAS
We use an incident record that combines guardrails, metric definitions, data maturity, source reconciliation, change history and segment contribution. This stops a reporting delay from being confused with a commercial decline and prevents a blended average from hiding a local failure.
The response is sized to confidence. Confirmed defects are fixed; uncertain causes become tests; breached cash, stock or loss limits trigger a controlled hold or reduction. The final record states what changed, why, who owns it and when the decision will be revisited. This lives in performance marketing and the marketing audit.
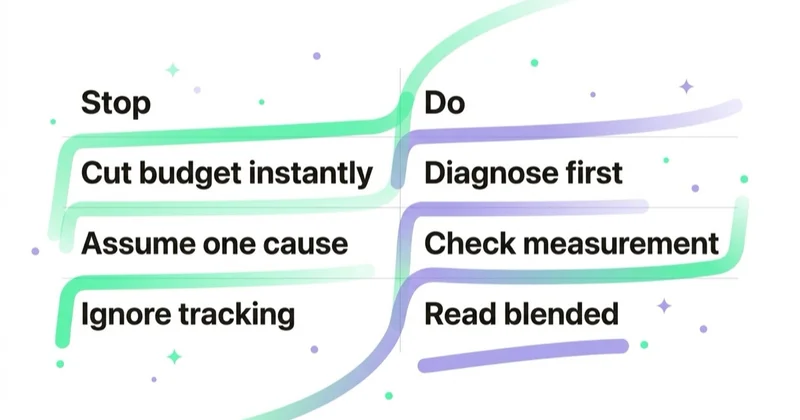
Stop doing / Do instead
| Stop doing | Do instead |
|---|---|
| Cutting or protecting all spend by reflex | Apply guardrails to the affected scope, then diagnose |
| Comparing today's ROAS with mature history | Align conversion lag and reporting date basis |
| Treating MER as channel proof | Use it as context and test incrementality for causal decisions |
| Explaining an average without segments | Find the segment contributing most to the absolute change |
| Calling every CTR decline fatigue | Test creative alongside reach, cost and downstream quality |
| Changing budget, offer and creative together | Use the smallest fix or test that can distinguish the cause |
Common mistakes
Common errors are comparing incomplete recent data, changing metric definitions mid-analysis, diagnosing from account averages and treating correlation as cause. Teams also overlook refunds, currency, stock, product mix and offline sales, or optimise media while the checkout or lead follow-up is failing.
FAQ
Why is my ROAS suddenly dropping?
Check for an immediate incident, then confirm that the comparison uses mature data and the same definitions. Decompose the change into cost per click, conversion rate and order value where applicable, and segment by market, product, customer type, device and campaign. A sudden change often aligns with a release, setting, offer, stock or reporting event—but verify it.
Should I cut spend if my ROAS is falling?
Reduce or pause the affected scope immediately if a loss, cash, stock, customer or policy guardrail is breached. Otherwise avoid blanket changes until the data is mature enough to diagnose. The right action may be hold, reduce, repair, replace creative, change the offer or leave the campaign stable for a defined test.
Why does ROAS drop when I increase my budget?
Diminishing marginal returns are common, but not the only explanation. The larger budget may change auction or audience mix, while timing, promotion, stock or reporting lag changes simultaneously. Estimate incremental contribution against a stable baseline or budget experiment and compare it with the allowable acquisition cost.
How do I know if a ROAS drop is a measurement problem?
Audit conversion actions, values, currencies, count settings, attribution windows, consent, deduplication, imports and change history. Validate representative transactions end to end and account for conversion lag. Stable total revenue is useful context but does not prove the platform decline is only measurement.
Can a website problem cause a falling ROAS?
Yes. Availability, price display, page errors, speed, discount logic, checkout and payment can change conversion or order value. But aggregate conversion also changes with traffic mix. Segment by landing page, device, browser, product and comparable traffic before assigning cause.
Is a seasonal ROAS drop something to worry about?
It may be expected, but verify it. Compare equivalent weekdays, holidays, promotions, stock and market conditions across multiple periods. Use a forecast or seasonal baseline where possible. A prior-year pattern does not automatically explain the current magnitude.
Key takeaways
- Protect agreed downside first, but avoid blanket budget reactions without evidence.
- Compare consistent definitions and mature conversion cohorts before declaring a decline.
- Decompose and segment ROAS to locate the actual cost, conversion or value driver.
- Use MER as business context, not proof that a channel caused the result.
- Turn each plausible cause into a confirmed fix or controlled test with an owner and review date.
Sources and further reading
- Google Ads Help — About conversion value and ROAS
- Google Ads Help — Conversion lag reporting for CPA and ROAS
- Google Ads Help — Missing data and discrepancies with Analytics
- Google Analytics Help — Attribution settings and lookback windows
- Google Analytics Help — Data freshness and changing attribution credit
Continue learning
Continue reading

What Is Performance Marketing? (And How It Differs From Growth and Brand)
Performance marketing connects media investment with measurable business outcomes and improves those outcomes through continuous testing. Learn how it works, which channels it covers, how to measure it beyond platform ROAS and how it complements growth and brand marketing.
How to Choose a Performance Marketing Agency
Choose a performance marketing agency with a defined brief, evidence-based scorecard and clear commercial safeguards. This guide covers team evaluation, measurement, account access, fees, contracts and handover.

How to Get More From Your Existing Ad Budget (Improve Marketing Efficiency)
Improve the return from an existing ad budget by validating measurement, protecting profitable demand, testing allocation, improving the offer and conversion path, and tracking marginal business value.


































