
An existing ad budget can often be allocated better, but “same spend, more revenue” is not guaranteed. Efficiency work is a disciplined search for the current constraint: unreliable measurement, low-value demand, an offer or page problem, poor lead handling, inventory limits or budget trapped below its best marginal use.

The aim is not the highest reported ROAS. It is the greatest sustainable business contribution within the budget, subject to volume, margin, cash flow and customer-quality guardrails. That may require cutting spend in one place, increasing it in another or accepting a lower ratio to gain more total profit.
TL;DR
- Validate the objective first. Confirm primary conversions, values, delay, consent effects and reconciliation with CRM or order data.
- Think marginally. Historical average ROAS does not show what the next or last unit of spend contributed.
- Protect profitable volume. Pausing every below-average campaign can shrink total contribution and remove assisted or incremental demand.
- Reallocation needs a test. Platform forecasts and simulators are useful estimates, not guarantees; stage material changes and monitor guardrails.
- Conversion improvement is not free. Research, design, engineering and experimentation cost money, and a higher completion rate can reduce lead quality.
- Blended metrics need context. MER tracks the whole system but cannot identify which channel caused the change.
- Scale and efficiency interact. Diminishing returns mean the best efficiency ratio and the highest total profit usually occur at different spend levels.
Efficiency vs diagnosing a drop vs scaling
Three different problems get confused. Diagnosing a drop is what to do when ROAS or results have fallen — that's covered in why is my ROAS dropping, and it's about finding a cause. Scaling is spending more to get more, which works only once the account is efficient. Improving efficiency — this article — is the middle move most accounts skip: the account is stable and working, nothing's broken, but there's more revenue available from the same budget if the waste is removed and the money moves to what pays.
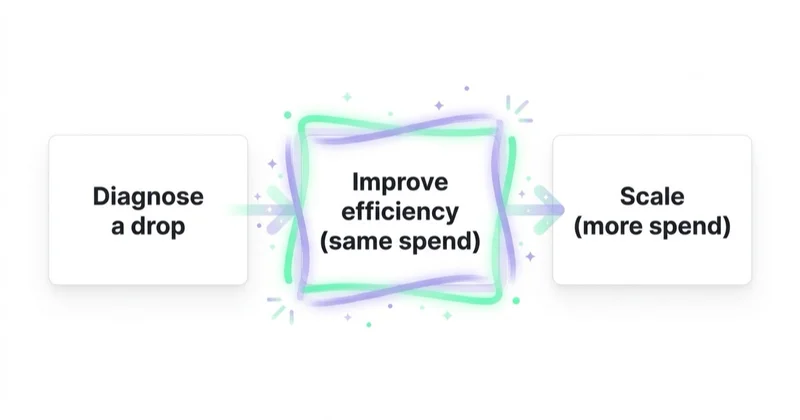
Do not assume a fixed share of spend is “waste” because it has a lower platform ROAS. Some activity reaches new customers, supports later conversion or has too little data to judge. Conversely, strong attributed performance can capture demand that would have converted anyway. Diagnose with mature cohorts, business value and experiments where the decision is material.
Glossary
- Marketing efficiency — revenue (or profit) produced per unit of marketing spend.
- Efficiency vs scale — getting more from the same budget vs getting more by adding budget.
- Blended efficiency / MER — revenue divided by a defined marketing-spend scope; useful for the whole system but not causal attribution.
- Conversion rate — share of clicks/sessions that become revenue; a whole-account multiplier.
- Reallocation — moving budget from lower-return to higher-return placements/campaigns.
- Incrementality — the revenue that wouldn't have happened without the spend (vs claimed).
The efficiency levers, in diagnostic order
There is no universal ROI order. Use the sequence below to avoid optimising symptoms before the data and commercial objective are trustworthy:
| Lever | What it does | Typical return |
|---|---|---|
| 1. Measurement and economics | Verify outcomes, values, delay, margin and customer quality | Prevents optimisation to the wrong signal |
| 2. Eligibility and obvious leakage | Fix broken URLs, disapprovals, irrelevant queries, duplicates and tracking errors | Removes preventable loss |
| 3. Marginal allocation | Model and test budget or target changes across comparable opportunities | Seeks more contribution from the same spend |
| 4. Offer, creative and conversion path | Improve relevance, persuasion, usability and sales follow-up | Addresses demand-to-revenue loss |
| 5. Incrementality and portfolio view | Use lift or geo tests where feasible; reconcile blended performance | Tests whether activity adds business outcomes |
Within each step, prioritise by expected value, confidence and effort. Preserve an annotated baseline, allow for conversion delay and change one material allocation assumption at a time when interactions would make the result unreadable.
Conversion rate is one multiplier—not a free one
If the same 1,000 qualified visits produce 20 purchases, conversion rate is 2%. If a valid test raises purchases to 30 with traffic cost and order quality unchanged, it becomes 3% and media cost per purchase falls by one third. Those conditions matter: the improvement is not transferable to every channel if traffic mix changes, and producing and testing the change has a cost.
Investigate the landing page and conversion path when relevant traffic fails to progress. For lead generation, follow the outcome through qualification and sale; a shorter form may raise submissions while lowering close rate. For ecommerce, include margin, returns and cancellations. Optimise the complete outcome, not the easiest on-page event.
Why blended measurement comes first
Platform attribution is useful for bidding and delivery diagnosis, but channels can overlap and outcomes can be modelled or unobserved. Blended MER shows whether the total business relationship between revenue and spend is moving, but promotions, pricing, seasonality and organic demand also move it. Use both views with CRM, order and margin data. When causal impact matters and volume permits, controlled lift experiments compare exposed and control groups.
How Space Ads approaches efficiency
Our efficiency work begins with a common value definition across media and business systems. We then identify the binding constraint and rank interventions by expected contribution, confidence, effort and reversibility. Budget changes are modelled, staged and reviewed after the relevant conversion cycle.
The outcome may be a query exclusion, a better conversion value, a new creative or page test, faster lead handling, a budget transfer—or evidence that the current budget is already close to the practical frontier. A marketing audit should make those assumptions visible; ongoing performance marketing tests and revises them.
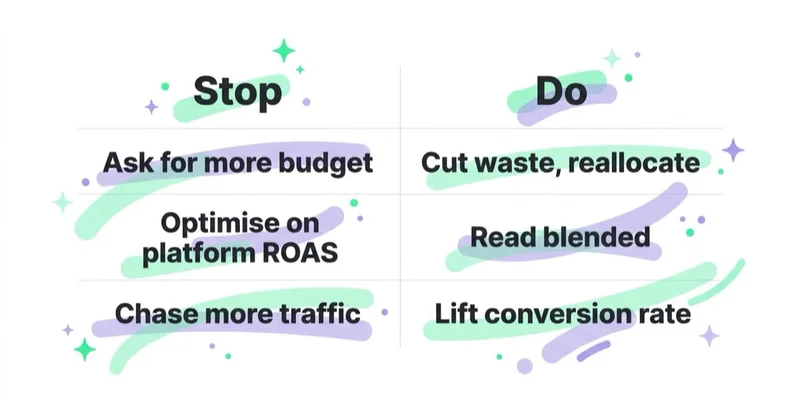
Stop doing / Do instead
| Stop doing | Do instead |
|---|---|
| Treating highest ROAS as the only goal | Optimise total contribution within volume and risk constraints |
| Calling every below-average segment waste | Check maturity, value, role and incrementality |
| Reallocating from historical averages alone | Estimate marginal returns and stage the change |
| Optimising platform or blended data alone | Reconcile attribution, business data and experiments |
| Improving form completion at any cost | Protect qualification, margin and customer experience |
| Applying forecasts as promises | Treat platform planners and simulators as decision inputs |
Common mistakes
Common errors are cutting low-volume campaigns from immature data, moving budget to brand capture because it has the best attributed ROAS, ignoring diminishing returns and raising conversion rate with lower-quality outcomes. Another is evaluating a change before the conversion cycle matures. These decisions make the dashboard look efficient while reducing total profit or future demand.
FAQ
How do I get more from my existing ad budget without spending more?
First verify conversion values and business economics. Then fix clear leakage, estimate marginal returns across campaigns, and test the most important constraint in the offer, creative, page or sales process. Reconcile platform results with blended and CRM or order data. There is no universal biggest lever, and the account may already be near its current efficiency frontier.
What's the difference between improving efficiency and scaling?
Efficiency concerns value produced per unit of spend; scaling concerns total value as spend changes. They interact through marginal returns. A lower ROAS at higher spend may still create more total contribution, while extreme efficiency can indicate underinvestment. Model and test the next budget step against profit, cash flow and capacity rather than requiring a perfect account first.
Which lever gives the biggest efficiency gain?
It depends on the binding constraint. Broken conversion values can make measurement the priority; irrelevant queries may make exclusions valuable; limited profitable coverage may make creative or product data the issue; weak lead handling may dominate the whole funnel. Rank opportunities using expected value, evidence, effort and risk, then test the highest-priority hypothesis.
How is this different from fixing a dropping ROAS?
Fixing a dropping ROAS is diagnosing a decline — finding what changed and reversing it. Improving efficiency is about a stable, working account where nothing is broken but more revenue is available from the same spend. Different starting point, different work: one looks for a cause, the other looks for the waste and the unconverted traffic sitting inside a budget that already looks fine. If your results have fallen, diagnose the drop first; if they're stable, improve the efficiency.
Why measure blended if I just want to be more efficient?
Blended measurement reveals whether total revenue and defined marketing spend move together, which helps catch cross-channel attribution overlap. It does not identify the cause: seasonality, price, promotions and organic demand also affect the ratio. Use it as one portfolio view alongside platform delivery data, business outcomes and incremental tests.
How do I find the efficiency gap in my account?
Audit the chain from conversion definition and value through campaign delivery, marginal allocation, landing experience and downstream sale. Document each finding with evidence, expected financial effect, confidence, effort, owner and validation method. A marketing audit should also say when the evidence is insufficient and what data must be collected next.
Key takeaways
- Optimise sustainable contribution within volume, margin, cash-flow and customer-quality constraints.
- Validate conversion values and data maturity before cutting or moving budget.
- Compare marginal returns rather than historical average ROAS alone.
- Treat page, creative and sales-process improvements as investments with guardrails.
- Reconcile platform, blended and business data; use experiments when causal impact matters.
Sources and further reading
- Google Ads Help — About Performance Planner
- Google Ads Help — Bid, budget and target simulators
- Google Ads Help — About Conversion Lift
- Google Ads Help — About Google Ads experiments
Continue learning
Continue reading
How to Choose a Performance Marketing Agency
Choose a performance marketing agency with a defined brief, evidence-based scorecard and clear commercial safeguards. This guide covers team evaluation, measurement, account access, fees, contracts and handover.

Why Is My ROAS Dropping? The Usual Suspects, in Order
A ROAS decline can come from reporting, media cost, traffic mix, conversion, order value or a changed business context. Use this diagnostic sequence to protect downside, compare mature data and isolate the real driver.

What Is Performance Marketing? (And How It Differs From Growth and Brand)
Performance marketing connects media investment with measurable business outcomes and improves those outcomes through continuous testing. Learn how it works, which channels it covers, how to measure it beyond platform ROAS and how it complements growth and brand marketing.


































