
A growth plateau means a chosen business metric has stopped increasing over a meaningful period. Before explaining it, define the metric: gross revenue, contribution, active customers, qualified pipeline, market share or another outcome. A company can have flat revenue while profit improves, or growing platform conversions while new-customer contribution stalls.

The cause may sit in acquisition, conversion, retention, purchase frequency, order value, product availability, sales capacity, geography, pricing or measurement. The practical task is to quantify which component stopped contributing and choose the smallest credible test of the next growth lever.
TL;DR
- Define and validate the plateau. Use mature data, comparable periods, inflation/currency context and a clear source of truth.
- Decompose growth. New, reactivated and retained customers; purchase frequency; order or contract value; margin.
- Check operating constraints. Stock, fulfilment, sales capacity, approval speed and cash can cap growth before media does.
- Estimate the response curve. Determine whether additional spend still creates incremental contribution at an acceptable cost.
- Do not add channels by reflex. A new platform helps only when it reaches a useful opportunity, can be operated well and can be measured.
- Treat creative, offer and product as separate hypotheses. Each changes a different part of the growth equation.
- Build an opportunity portfolio. Balance near-term improvements with longer-term demand, product, market and retention bets.
A plateau is a different problem from a decline
A plateau and decline are useful descriptions, not mutually exclusive diagnoses. Total revenue may be flat because a growing product offsets a declining one, or because new-customer acquisition offsets worsening retention. Stable account totals can therefore hide a serious local decline.
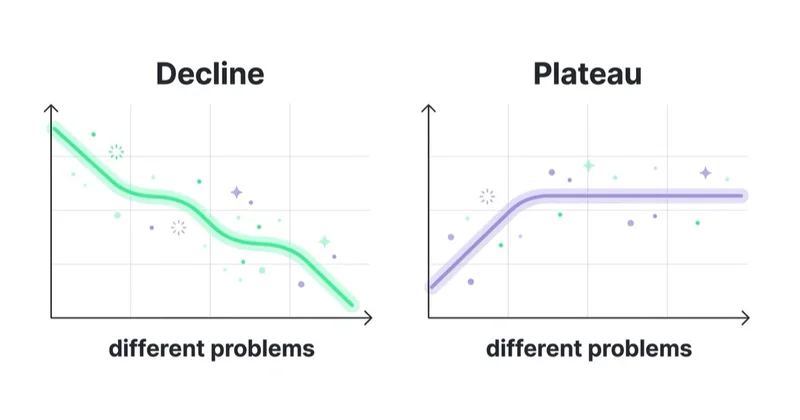
Confirm the pattern before calling it structural:
- use complete weeks or months appropriate to the sales cycle;
- adjust comparisons for holidays, promotions, launches and stock;
- separate nominal growth from currency and price effects;
- use net or contribution outcomes where returns and margin matter;
- allow cohorts enough time to mature;
- inspect product, market and customer segments, not only totals.
If the result is actually declining, use the diagnostic for falling ROAS or Meta performance. If it is flat, locate the offsetting components before searching for a new channel.
Start with the growth equation
For a repeat-purchase business, a useful decomposition is:
revenue = active customers × purchase frequency × average order value
And active customers are shaped by new + reactivated + retained − churned customers. For B2B, replace orders with qualified opportunities, win rate, contract value and sales-cycle timing. Then add contribution margin and cash timing to keep growth commercially meaningful.
Build a bridge from the last growing period to the plateau:
- How much came from new customers?
- Did repeat rate, churn or time to second purchase change by cohort?
- Did price or product mix lift AOV while unit volume stalled?
- Did returns, discounts or fulfilment cost reduce contribution?
- Did one market or product offset another?
This prevents the acquisition team from being asked to solve a retention, pricing or capacity problem. GA4 provides cohort and retention views as a starting point, but commerce, CRM and finance systems should remain the operational sources for customer and margin definitions.
Constraint 1: demand and media response
The reachable opportunity for a given proposition, market and channel is finite at a point in time. As spend grows, marginal returns often decline. That does not mean performance media only "harvests" while brand media only "creates" demand: search, social, creators, product experience and referrals can all influence discovery and response in different ways.
Estimate the spend-to-incremental-contribution curve. Platform-attributed ROAS is not enough. Use budget experiments, lift studies, geo tests or a calibrated marketing-mix model where feasible. Google describes Conversion Lift as a controlled experiment that compares treatment and control outcomes; availability and data requirements apply.
If the current curve is still profitable, deeper investment may be rational. If it has flattened, test a materially different proposition, market, audience, product or demand-building programme rather than assuming more impressions will change it. See brand strategy and performance.
Constraint 2: channel concentration
Channel concentration creates risk, but adding platforms does not automatically create incremental demand. Audiences overlap, attribution double-counts and a small test may fragment the budget without producing a decision.
Before opening a new channel, write its role:
- audience or situation the current mix does not reach well;
- message and format native to that environment;
- outcome and commercial threshold;
- tracking, lift or holdout plan;
- creative, feed, landing-page and operational requirements;
- minimum viable test budget and stop condition.
Sometimes the better expansion is not another ad platform: partner distribution, sales development, marketplace presence, lifecycle communication, international availability or product-led referral may reach the constraint more directly.
Glossary
- Plateau — a defined outcome remains broadly flat over a decision-relevant period.
- Response curve — the relationship between spend and estimated incremental outcome at different spend levels.
- Cohort — customers grouped by a shared start point or characteristic and observed over time.
- Diminishing returns — each additional dollar of spend buying less efficient reach as you scale.
- Constraint — the current factor most limiting system growth, such as demand, stock, conversion or retention.
- Incremental growth — additional outcome caused by an intervention beyond the counterfactual baseline.
Constraint 3: proposition, creative and conversion
Separate these layers:
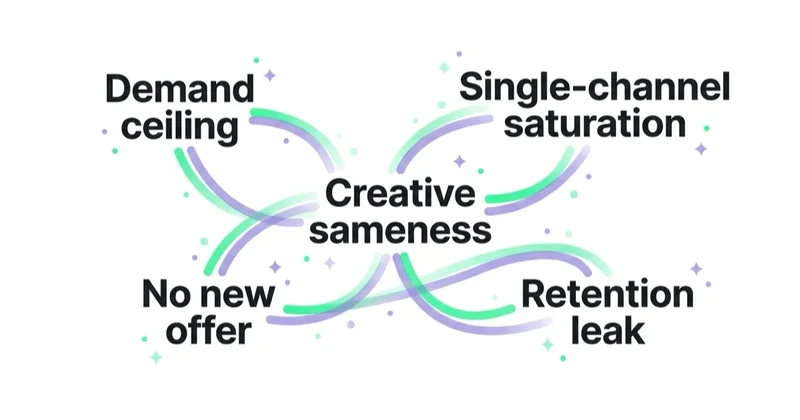
- Product and market: does the product solve a meaningful problem for an addressable segment at a viable price?
- Offer: are price, bundle, trial, financing, delivery and risk reversal appropriate and sustainable?
- Creative: can the team communicate distinct needs, proof, objections and use cases in the available placements?
- Journey: does the landing page, sales process or checkout help qualified demand progress?
A new hook cannot repair weak product availability, and a discount can lift revenue while destroying contribution or training customers to wait. Test concepts through a creative testing framework, but validate downstream quality and margin. For offer or product expansion, use customer research, demand evidence and a controlled launch rather than adding variants because the ad account is flat.
Constraint 4: retention, monetisation and capacity
Acquisition can grow while revenue plateaus if churn rises or later cohorts repeat less. Review first-to-second purchase, retention, reactivation, subscription cancellation, lead-to-sale rate and cohort contribution. A lifecycle programme cannot compensate for a product or service experience that causes churn; feed the findings back to operations and product.
Capacity can also be the ceiling. Stockouts, slow delivery, limited appointments, long sales response, onboarding capacity or working capital may suppress conversion and repeat behaviour. Marketing should not create demand the business cannot serve safely or profitably. The growth plan may therefore prioritise supply, sales operations or customer experience before media.
Constraint 5: metric and measurement mismatch
If finance revenue is growing while an ad dashboard is flat, the business has not plateaued on revenue; the marketing measure and business outcome have diverged. Investigate attribution, scope, conversion delay, channel overlap and unobserved offline activity rather than calling this a "measurement plateau."
Branded search and direct traffic are not proof of brand impact: direct can include missing referral data, and branded search has several possible drivers. Use them as context. Combine source-of-truth business trends with experiments, cohort analysis and an appropriately specified model. MER can show overall efficiency but cannot identify which activity caused growth. See MER vs ROAS.
How to break through: match the lever to the wall
Turn the growth bridge into an opportunity tree. For each lever, estimate impact range, confidence, time to evidence, cost, reversibility, dependency and downside. A balanced portfolio may include:
- Now: repair stock visibility, lead routing, checkout errors or high-confidence conversion friction.
- Next: test a new proposition, creative territory, retention intervention or channel with a defined control.
- Later: build product, market, brand, partner or capacity capabilities that require longer evidence windows.
Do not rank ideas only by attributed ROAS. A retention improvement and a brand test operate on different time horizons. Give each an appropriate outcome, guardrail and review date.
How Space Ads approaches a plateau
We begin with a growth bridge across new, retained and reactivated customers, frequency, value and contribution. We then add media response, conversion, product, market and capacity evidence to identify the likely constraint.
The output is an opportunity portfolio, not a list of channels: hypotheses, expected business effect, evidence level, owner, dependency, test design and stop condition. Short-term repairs and longer-term demand or product bets are reported separately so one is not judged on the other's timeframe. This whole-system work can sit with a fractional CMO or performance marketing partner.
Stop doing / Do instead
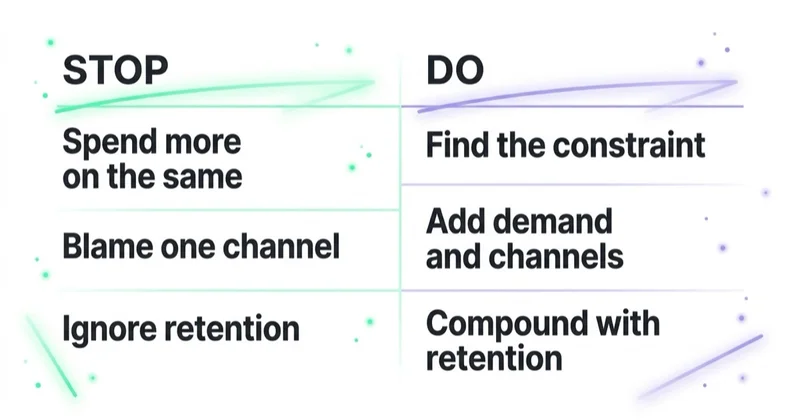
| Stop doing | Do instead |
|---|---|
| Calling flat attributed conversions a business plateau | Define the outcome and reconcile it with the source of truth |
| Asking acquisition to offset rising churn | Analyse retained, reactivated and new cohorts separately |
| Adding a channel because the current one is flat | Define incremental audience, role, readiness and test first |
| Increasing spend without a response curve | Estimate marginal contribution and set a loss guardrail |
| Discounting to manufacture top-line growth | Measure margin, returns, repeat behaviour and reference-price effects |
| Ignoring stock or sales capacity | Remove the operating constraint before creating more demand |
Common mistakes
Common mistakes include defining growth only as gross revenue, comparing immature cohorts, hiding churn behind acquisition and adding channels without incremental measurement. Teams also confuse price increases with customer growth, overlook capacity and choose only quick media tests while the real constraint requires product or market work.
FAQ
Why has my marketing growth plateaued?
Possible causes include slower new-customer acquisition, weaker retention, lower frequency or value, declining conversion, limited stock or sales capacity, a saturated media response curve or a measurement mismatch. Build a growth bridge and identify the component contributing most to the shortfall.
How do I break through a marketing growth plateau?
Define the plateau, validate the data, decompose the growth equation and identify the current constraint. Rank opportunities by impact, confidence, time, cost and downside. Run a controlled test or remove a confirmed operational defect, then update the growth bridge rather than changing several levers at once.
Why does spending more not grow my revenue anymore?
Diminishing returns may be present, but verify the response curve. Revenue can also stay flat because stock, conversion, retention, order value or another channel changed at the same time. Compare incremental contribution from the added spend against a stable baseline or experiment.
Is my plateau a real one or a measurement problem?
Use finance, commerce or CRM data to define the business outcome and reconcile it with platform and analytics reports. Check attribution settings, conversion lag, customer status and offline outcomes. If source-of-truth revenue is growing, revenue has not plateaued; the discrepancy is a measurement question.
How is a plateau different from a decline?
A plateau is a broadly flat defined outcome; a decline is a falling one. They can coexist across segments: growth in one product may offset deterioration in another. Both require decomposition before action. A plateau can result from a defect, so do not assume nothing is broken.
Should I add channels or go deeper on the one that works?
Go deeper when a credible response curve shows profitable incremental opportunity and operations can support it. Add a channel when it has a distinct role, reachable audience, native creative, adequate test budget and measurement plan. Blended metrics alone cannot reveal channel saturation.
Key takeaways
- Define growth and validate the period before diagnosing a plateau.
- Decompose customers, retention, frequency, value and contribution by cohort and segment.
- Include demand, media response, product, conversion, capacity and measurement in the constraint map.
- Add channels or budget only with an incremental role and testable commercial threshold.
- Manage a portfolio of immediate repairs, controlled tests and longer-term capabilities.
Sources and further reading
- IPA / Les Binet & Peter Field — The Long and the Short of It (demand creation vs activation)
- Google Ads Help — Conversion Lift and incremental outcomes
- Google Analytics Help — Retention reporting and cohort views
- Google Meridian — Incremental outcomes, marginal ROI and response curves
Continue learning
Continue reading

Lead Generation for Online Courses and Education Providers
Education lead generation must connect an honest promise with learner fit, enrolment and course starts—not just form volume. Learn how to design the journey, evidence claims and measure each intake.

How to Choose a Performance Marketing Agency
Choose a performance marketing agency with a defined brief, evidence-based scorecard and clear commercial safeguards. This guide covers team evaluation, measurement, account access, fees, contracts and handover.

Website Marketing: How to Actually Drive Revenue From Your Site
A website creates commercial value when it helps the right people complete the right task and gives the business reliable feedback. This guide connects audience journeys, acquisition, experience, measurement and experimentation.


































