
A useful agency report creates one shared view of performance: what the business and campaign were meant to achieve, what was spent, what happened, how reliable the evidence is and what each party will do next. It should be concise enough to use and detailed enough to audit.
Revenue matters for commercial programmes, but it is not the only legitimate outcome. A brand campaign may be assessed with reach and lift; a lead programme with accepted opportunities and pipeline; recruitment with qualified applications. The reporting design should follow the agreed objective and decision—not force every activity into one ratio.
TL;DR
- Agree the reporting contract first. Define goals, metrics, formulas, sources, attribution settings, cadence, owners and data access.
- Lead with the decision level. Show commercial or campaign outcomes, plan versus actual and material drivers.
- Keep platform metrics in context. Reach, impressions, clicks and attributed conversions can be useful inputs when tied to an objective.
- Show uncertainty and data quality. Reconciliation gaps, conversion delay, consent effects and model changes belong in the report.
- Separate observation from interpretation. State what changed, the plausible causes and what evidence would distinguish them.
- Close with owned actions. Every decision needs an owner, deadline, expected effect and review point.
- Preserve access and auditability. The client should be able to inspect source accounts, definitions and change history appropriate to the engagement.
Reporting is where accountability lives (or doesn't)
Reporting is a governance mechanism for both sides. The agency is accountable for work, analysis and recommendations within scope; the client may own pricing, inventory, sales follow-up, product changes and financial data. A good report makes those dependencies visible instead of assigning every movement to media.
It also protects institutional memory. A future reader should be able to see what changed, why it changed, what evidence was available and whether the expected result occurred. This matters when teams, budgets or agencies change. Reporting quality is one input to evaluating an agency relationship, but a polished document alone does not prove good execution.
What good reporting contains
A strong report can use this order:
- Executive summary: objective, headline outcome, confidence, most important change, risk and required decision.
- Plan versus actual: media spend, agency or production cost where in scope, pacing, forecast and variance explanation.
- Outcome scorecard: agreed business and campaign KPIs with target, prior period and a relevant comparison window.
- Drivers: audience, creative, offer, product, geography, device or funnel changes that materially contributed.
- Tests and change log: hypothesis, setup, result, limitation and decision; major account or site changes with dates.
- Data quality: source-of-truth reconciliation, tracking incidents, conversion delay, attribution/model changes and missing data.
- Risks and dependencies: stock, approvals, sales capacity, feed quality, consent, policy or technical blockers.
- Next actions: decision, owner, due date, expected effect and when it will be reviewed.
Not every section needs a slide. The report should surface exceptions and decisions while the supporting dashboard or appendix retains drill-down detail.
Glossary
- Blended ROAS / MER — defined revenue divided by defined media or marketing spend; a trend metric, not proof of causality.
- Platform-attributed ROAS — revenue credited under a platform's eligible events, window and attribution method.
- Leading indicator — an earlier signal connected by a hypothesis to a later outcome, such as qualified traffic or product-page use.
- Decision document — a report whose purpose is to inform a decision, not to display activity.
- Reporting cadence — how often (and how deeply) results are reported and reviewed.
- Source of truth — the designated operational system for a measure, such as finance, commerce or CRM.
- Data dictionary — metric names, formulas, inclusions, exclusions, owners and sources.
The red flags of bad reporting
Poor reporting has recognisable, constructive warning signs:
| Red flag | What it hides |
|---|---|
| KPI definitions or sources change without notice | Comparisons may no longer describe the same thing |
| Spend is shown without plan, fees or pacing context | The client cannot assess delivery against budget |
| Platform conversions are presented as incremental sales | Attribution is being treated as causality |
| Revenue is shown without margin, refunds or customer mix where material | Growth may not be commercially equivalent |
| Charts lack an appropriate baseline or comparison period | Normal volatility can be presented as a trend |
| Conclusions exceed the evidence | Correlation is being reported as a known cause |
| Actions have no owner, date or expected result | Recommendations cannot be governed or reviewed |
| Source access or definitions are unavailable | The report cannot be reproduced or audited |
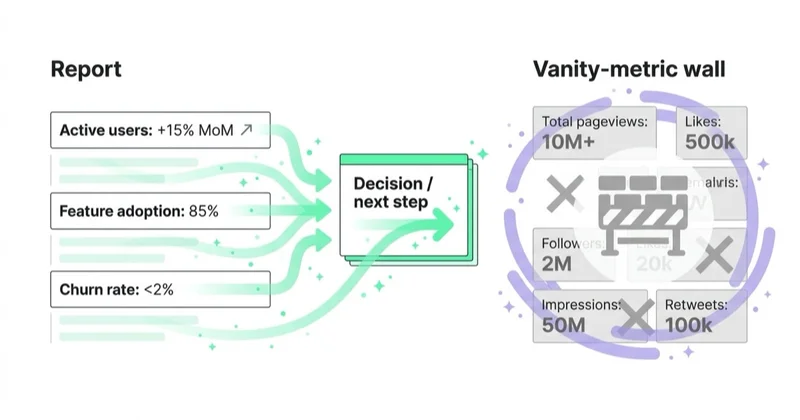
Impressions and clicks are not inherently vanity metrics. They are valid delivery or response measures when the campaign objective and causal chain require them. They become distracting when they are shown without targets, quality, cost or connection to the next outcome. Likewise, an all-green period may be real; the concern is whether thresholds and explanations are consistent.
The metric contract
Agree definitions before the first report. For example, "new-customer CAC" requires a new-customer rule, cost numerator, order status, refund treatment, reporting delay and source system. "MER" requires a revenue basis and a decision on whether spend includes only media or also creative and fees.
For every headline metric, record:
- business question and owner;
- formula, currency and tax treatment;
- included and excluded channels, customers and costs;
- source system and refresh time;
- attribution window or cohort window;
- target, guardrail and comparison period;
- known limitations and expected reconciliation gap.
This prevents a plausible-looking disagreement from becoming a trust problem. Google itself documents that Analytics and Google Ads can differ because of scopes, counting methods, windows and reporting delay even when implementation is functioning.
What YOU track vs what the AGENCY should report
A dashboard and report are interfaces, not opposing categories. A dashboard can include annotations and decisions; a concise report can link to live drill-downs. The required outcome is the same: timely monitoring plus periodic interpretation and accountable action.
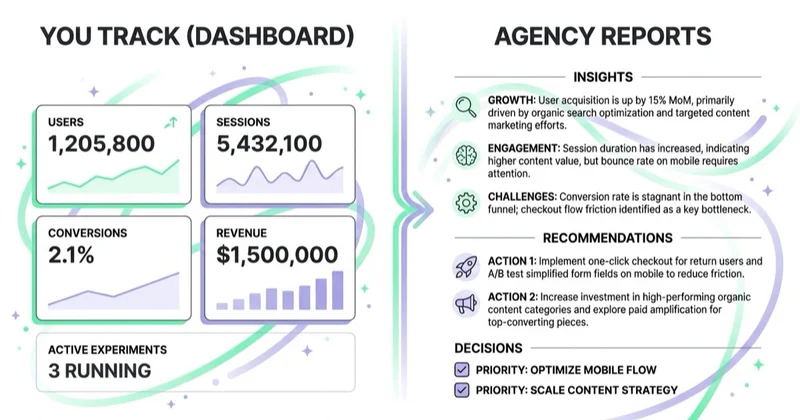
Use the live view for pacing, incidents and operational monitoring. Use the review for trends, experiments, commercial interpretation and decisions that need discussion. Keep a snapshot or versioned record so later changes in source data do not erase what the team saw at decision time. For dashboard design, see the marketing dashboard growth teams should track.
Cadence should match the decision
High-spend pacing, stock incidents or tracking failures may need daily monitoring. Creative and bid decisions may need weekly review. Pipeline, contribution, refunds or brand lift may require monthly or quarterly windows. A single monthly deck cannot serve every timescale.
Define escalation rules: who is notified, through which channel and by when if spend, tracking, policy, stock or performance crosses a guardrail. Routine monitoring should not wait for the reporting meeting.
How Space Ads approaches reporting
We agree the reporting contract during onboarding: goals, formulas, data sources, access, cadence, comparison windows and decision rights. The executive view starts at the outcome appropriate to the brief, while platform detail remains available for diagnosis.
Reports distinguish observed facts, interpretation and recommendation. Material changes are logged, tests retain their hypothesis and limitations, and data discrepancies are documented rather than silently normalised. Actions are assigned across Space Ads and the client because stock, offer, approvals, sales response and tracking can sit on either side. This connects the marketing audit with web analytics.
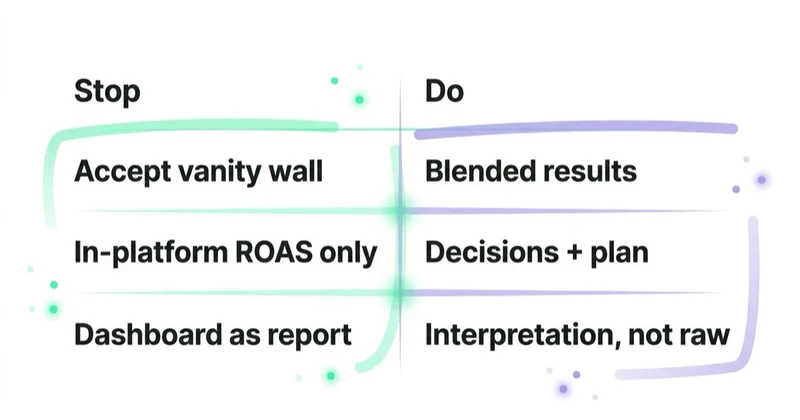
Stop doing / Do instead
| Stop doing | Do instead |
|---|---|
| Starting with charts before definitions | Agree goals, formulas, sources and owners first |
| Treating attributed revenue as incremental | Label attribution and test causality where feasible |
| Reporting revenue without commercial quality | Add margin, refunds, new-customer or pipeline context where relevant |
| Hiding discrepancies by forcing totals to match | Reconcile sources and explain the expected gap |
| Listing recommendations without governance | Assign owner, date, expected effect and review point |
| Giving the client only exported PDFs | Preserve appropriate account access and reproducible source data |
Common mistakes
Common mistakes include changing attribution settings without annotating the report, comparing partial periods, ignoring conversion delay and mixing gross revenue with net spend or vice versa. Another is reporting lead volume without agreed qualification stages, which rewards cheap form fills rather than commercial progress.
FAQ
What should a marketing agency report include?
Include the agreed objective; plan versus actual spend; outcome scorecard; material drivers; tests and change log; data-quality notes; risks and dependencies; and next actions with owners and dates. Add channel detail only to the depth needed for decisions and auditability.
What are the red flags in marketing agency reporting?
Watch for undefined or changing KPIs, no budget context, platform attribution presented as causality, unexplained source discrepancies, claims stronger than the evidence and actions without owners. Missing source access or a refusal to document formulas is also material. One positive month or the use of reach and clicks is not a red flag by itself.
Isn't a dashboard the same as a report?
Not necessarily. A dashboard can include commentary, annotations and actions, while a report may link to live detail. Ensure the operating model provides both timely monitoring and periodic interpretation, decisions and a versioned record.
Why does my agency's report look great while sales are flat?
The measures may use different scopes or timing. Platform results can rise while total sales stay flat because of attribution overlap, returning-customer mix, offline changes, weaker organic demand, refunds or other channels. Reconcile definitions and source systems first, then test the most plausible explanation. MER provides context but cannot identify the cause by itself.
How often should a marketing agency report?
Match cadence to risk and decision speed. Pacing and tracking incidents may need daily alerts; campaign decisions may need weekly review; pipeline, returns or lift may need longer windows. Document the schedule and escalation rules rather than relying on one meeting for everything.
What should I do if my agency's reporting is poor?
Start by agreeing the missing objective, definitions, sources, access and decision cadence in writing. Ask for a sample revised report and assign owners for client-side data. If material discrepancies or access issues persist, escalate through the contract's governance process; an independent measurement review may then be appropriate.
Key takeaways
- Agree metric definitions, sources, access and decision rights before designing charts.
- Lead with the outcome appropriate to the brief and show plan versus actual.
- Label attribution, uncertainty, delays and reconciliation gaps explicitly.
- Preserve tests, change history, risks and actions with owners and dates.
- Use cadence and escalation rules that match the speed and risk of each decision.
Sources and further reading
- Google Analytics Help — Scopes of traffic-source dimensions
- Google Analytics Help — Attribution models and reports
- Google Ads Help — Why Ads, Analytics and third-party data can differ
- IAB/MRC — Retail Media Measurement Guidelines: reporting and transparency
Continue learning
Continue reading
How to Choose a Performance Marketing Agency
Choose a performance marketing agency with a defined brief, evidence-based scorecard and clear commercial safeguards. This guide covers team evaluation, measurement, account access, fees, contracts and handover.

How to Tell If Your Marketing Agency Is Doing a Good Job
Evaluate an existing marketing agency with an agreed scorecard covering business impact, measurement quality, decisions, delivery, access, communication and commercial governance—not dashboard aesthetics.

How to Get More From Your Existing Ad Budget (Improve Marketing Efficiency)
Improve the return from an existing ad budget by validating measurement, protecting profitable demand, testing allocation, improving the offer and conversion path, and tracking marginal business value.


































