
Google Ads benchmark tables look precise, but the figure in a cell is only useful when you know what produced it. A median Search CTR for one market cannot judge a Performance Max campaign in another. A lead conversion rate cannot be compared with a qualified-opportunity rate. Even two ecommerce accounts may count revenue, refunds and attribution differently.
This guide deliberately does not present one static “industry average” table. Such tables age quickly and often omit sample composition. Instead, it shows how to qualify an external benchmark, calculate comparable metrics and build an internal reference that supports a business decision.
TL;DR
- A benchmark needs a denominator and scope. Confirm the campaign type, market, device, network, time period and whether the statistic is a mean, median or percentile.
- Metric definitions must match. In Google Ads, conversion rate is conversions divided by ad interactions, which are not always clicks.
- The conversion action matters. Purchase, submitted lead, qualified opportunity and phone call are different outcomes and should not share one benchmark.
- Quality Score is diagnostic. The displayed 1–10 score is not an auction input or a business KPI; its components can point to relevance or landing-page issues.
- Compare like with like. Segment brand and non-brand, campaign type, geography, device and objective before drawing a conclusion.
- Use business outcomes as the final test. Margin, qualified pipeline and incremental revenue matter more than matching a published CTR or CPC.
Why a single Google Ads benchmark misleads
Google calculates Ad Rank for each auction using several factors: the bid, auction-time ad and landing-page quality, thresholds, competition, search context and the expected impact of assets. Location, device, time and the exact query can therefore change cost and position even inside one campaign. The mix of auctions in a third-party dataset will rarely mirror yours.
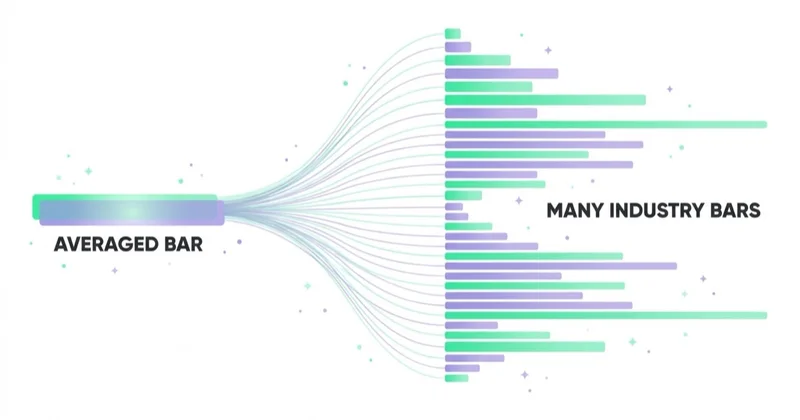
“Our CPC is above the industry average” is not yet a diagnosis. It may reflect a more competitive geography, different match mix, stronger commercial intent, a change in device mix or a different auction environment. Treat the external number as a question generator. The account's segmented history is usually a better reference, provided tracking and scope have remained consistent.
What drives each metric
Knowing what moves each benchmark is more useful than the number, because it tells you what's in your control.
| Metric | Mostly driven by | How controllable |
|---|---|---|
| CTR (clicks ÷ impressions) | Query and audience mix, ad relevance, format, position and assets | Partly controllable |
| Average CPC (cost ÷ clicks) | Bid strategy, auction competition, context, quality and query mix | Partly controllable |
| Conversion rate (conversions ÷ interactions) | Conversion definition, intent, offer, page, device and attribution | Partly controllable |
| Cost per conversion (cost ÷ conversions) | Media cost and the number of attributed conversions | An outcome, not a standalone lever |
| Quality Score | Expected CTR, ad relevance and landing-page experience | A Search-keyword diagnostic |
When the scopes and denominators align and interactions are clicks, CPA can be decomposed into average CPC divided by conversion rate. Use this relationship to locate the change: did traffic become more expensive, did fewer interactions convert, or did the conversion definition change? Then investigate the underlying cause. Improving relevance and landing-page usefulness may improve auction-time quality, but the displayed Quality Score itself is not a control knob. See how to lower CPC in Google Ads for the wider diagnostic.
Keyword intent is the hidden benchmark variable
Query intent is one important hidden variable, especially in Search. Commercial queries can attract more competition and may convert differently from research queries, but neither higher CPC nor higher conversion rate is guaranteed. Brand familiarity, offer strength, geography, device and the landing page can reverse the expected pattern.
Separate brand from non-brand and group queries by a repeatable intent taxonomy. Then compare equivalent groups across time, while checking whether budgets, ads, pages or tracking changed. Search terms that clearly do not match the offer may justify negative keywords, but a low immediate conversion rate alone does not prove that a research query has no value.
Glossary
- CTR — clicks divided by impressions for the selected scope.
- Average CPC — click cost divided by clicks; individual click prices can vary by auction.
- Conversion rate — conversions divided by eligible ad interactions, not universally by clicks.
- Cost per conversion — cost divided by conversions included in the chosen conversion column.
- Quality Score — a 1–10 diagnostic available at Search-keyword level, not an auction input.
- Mean vs median — the mean is sensitive to extreme values; the median describes the middle observation.
- Percentile — the value below which a stated percentage of observations falls.
Campaign type: compare only compatible scopes
Google Ads is not one inventory source. Search responds to queries; Shopping uses product data; Performance Max can serve across Google channels; Display and video involve different formats and interactions. A click-based metric also does not fully describe formats where an engaged view can contribute to conversion reporting.
Compare campaigns with the same objective and conversion action, then align attribution and interaction definitions. Google's Platform Comparable columns can help normalise selected metrics for supported campaign types, but they do not make different objectives equivalent. A published “Google Ads benchmark” that omits campaign type and measurement rules is too vague for account diagnosis.
Account for naming changes without inventing a performance break. From June 2026, Google began relabelling “Maximise conversions with a Target CPA” as “Target CPA” and “Maximise conversion value with a Target ROAS” as “Target ROAS”; Google says the underlying bidding behaviour did not change. Historical comparisons should follow the actual settings and goals, not treat the new label alone as a strategy migration.
Conversion rate depends on what you count
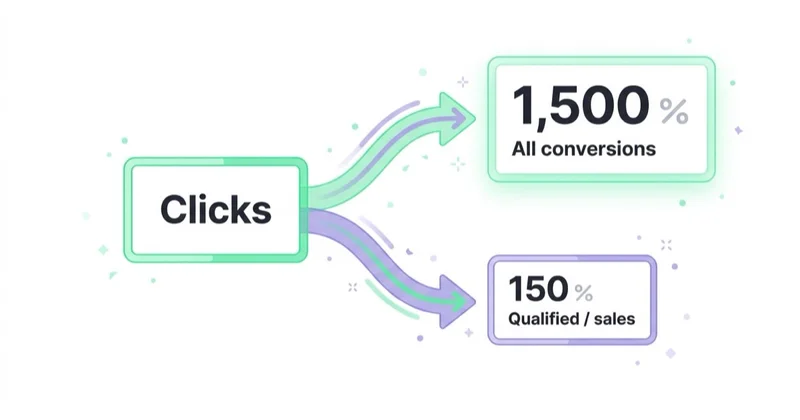
The conversion-rate benchmark is the easiest to fool yourself with, because "conversion rate" depends entirely on what you've defined as a conversion. If a cheap micro-action (a newsletter signup, a page view) is set as the conversion, the rate looks high but means little; if a genuine sale or qualified lead is the conversion, the rate is lower but real. Two accounts "reporting conversion rate" can be measuring completely different things, which makes cross-account comparison invalid before you start.
Before comparing conversion rates, confirm the primary action, count setting, attribution model, conversion window and whether view-through or engaged-view outcomes are included. For lead generation, compare the downstream qualified-lead or sale rate as well. A high form-submit rate can coexist with poor lead quality, the same measurement trap discussed in why your Google Ads aren't converting.
A five-step benchmark check
- Define the decision. Are you investigating rising costs, forecasting a launch or assessing execution quality?
- Align the scope. Match country, currency, period, campaign type, network, device and brand status.
- Align the metric. Use the same formula, conversion action, attribution rules and data-maturity window.
- Inspect the distribution. Prefer sample size, median and percentiles over one unexplained mean.
- Translate the gap into a test. A benchmark does not prescribe the fix. Validate whether the constraint is auction cost, traffic mix, page performance, measurement or economics.
For an internal benchmark, record the baseline period and annotate material changes. Compare year over year where seasonality matters and use recent weeks only after conversion delay has passed. If tracking, consent or conversion definitions changed, create a new baseline rather than joining incompatible periods.
How Space Ads approaches Google Ads benchmarks
We use external benchmarks to frame questions, not to declare an account healthy or broken. The working baseline is segmented by objective, campaign type, conversion action, brand status and market, with material tracking and strategy changes annotated. We then connect media metrics to revenue, margin and qualified pipeline.
Our approach decomposes the result. For example, a higher CPA may come from rising click cost, lower conversion rate, a different traffic mix or a stricter conversion definition. We use Quality Score components as diagnostic clues where relevant, then prioritise the change most likely to improve business value. This discipline underpins our Google Ads and performance marketing work.
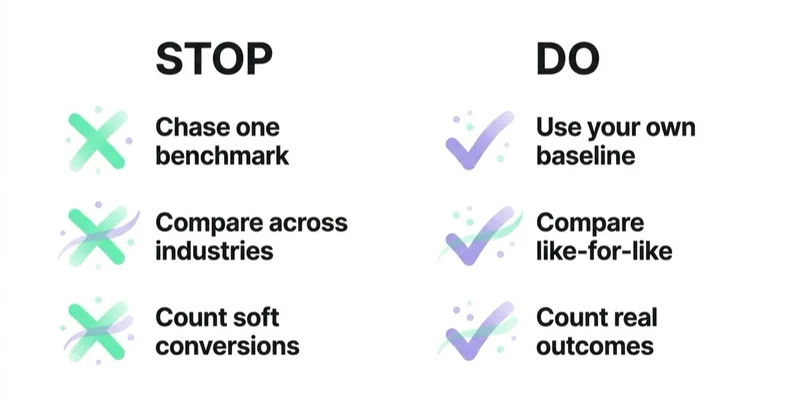
Stop doing / Do instead
| Stop doing | Do instead |
|---|---|
| Judging an account against one Google Ads average | Define the decision and align the comparison scope |
| Comparing campaign types on raw headline metrics | Match objective, conversion action and interaction rules |
| Treating high CPC as proof of poor management | Decompose auction context, query mix, bids and ad quality |
| Managing toward the 1–10 Quality Score | Use its components as clues alongside business metrics |
| Trusting conversion rate without its definition | Check action, attribution, count setting and conversion window |
| Joining data across a tracking change | Establish a new baseline and document the break |
Common mistakes
The recurring errors are treating a mean as a target, ignoring sample composition, mixing brand and non-brand traffic, comparing immature recent conversions with mature historical data, and overlooking changes in consent or tracking. Another is “optimising to the benchmark”: reducing valuable reach merely to lift CTR or excluding difficult but profitable sales because their CPA looks high.
FAQ
What is a good CTR for Google Ads?
There is no responsible universal number. First match campaign type, network, market, device and brand status. Then compare the same segment over time. A low CTR may indicate weak relevance or messaging, but it can also reflect position, query expansion, format or a deliberate move into broader demand. Judge it with conversion value and search-term quality, not in isolation.
What is the average cost per click in Google Ads?
Average CPC is cost divided by clicks for the selected scope. It varies with bids, strategy, competition, query context, geography, device, quality and season. Compare compatible segments and inspect whether conversion value justifies the price. A higher CPC can be acceptable when the traffic produces more profit; a low CPC is not automatically efficient.
What is a good conversion rate for Google Ads?
There is no universal figure. In Google Ads, conversion rate is conversions divided by eligible ad interactions. Its meaning depends on the action, count setting, attribution, window and campaign type. Compare purchases with purchases or qualified opportunities with qualified opportunities, then check value and margin. A higher rate built on low-quality outcomes is not an improvement.
How does Quality Score affect my benchmarks?
Quality Score is a diagnostic 1–10 estimate based on expected CTR, ad relevance and landing-page experience. Google explicitly states that the displayed score itself is not used in the auction; real-time evaluations of quality components are. Use below-average components to investigate specific issues, but do not treat Quality Score as a KPI or assume that changing the displayed number mechanically changes CPC.
Can I compare Search and Shopping or Performance Max benchmarks?
Not on raw CTR, CPC or conversion rate without aligning how interactions and conversions are counted. They use different inventory, formats and reporting contexts. Compare business outcomes with the same conversion action and attribution rules; use campaign-type metrics for diagnosis within that type. Google's Platform Comparable columns may help in supported cases, but objective and audience still need to match.
Why is my Google Ads cost per conversion so high?
First verify that the conversion action and reporting window are correct and mature. Then decompose cost per conversion into traffic cost, interaction-to-conversion rate and traffic mix. Investigate bids and auction context, queries or audiences, the offer, page experience and lead quality. The right response may be a measurement fix, a page test, a targeting change or accepting a higher CPA for more valuable customers.
Key takeaways
- A benchmark is useful only when its population, period and metric definitions are visible.
- Match campaign type, market, objective, conversion action, attribution and data maturity.
- Quality Score is diagnostic; its real-time components, not the displayed score, enter the auction.
- Use external figures to form questions and internal segmented history to test them.
- The final standard is profitable, incremental business value—not conformity to an average.
Sources and further reading
- Google Ads Help — About Quality Score
- Google Ads Help — Using Quality Score to guide optimisations
- Google Ads Help — About Ad Rank
- Google Ads Help — Conversion tracking basics
- Google Ads Help — Platform Comparable conversion columns
- Google Ads Help — How Smart Bidding strategies are organised
Continue learning
Continue reading

How Much Does Google Ads Cost? Pricing, CPC and Budgets Explained for 2026
Google Ads has no fixed price. You set the budget, while the auction determines actual CPC, CPM or CPV based on competition, bid, ad quality, context and campaign type. This guide explains pricing, budgets, CPA math and the full cost of running Google Ads.
Google Local Services Ads: The Pay-Per-Lead Channel for Local Businesses
A current guide to Google Local Services Ads and pay-per-lead Performance Max: eligibility, Google Verified, screening, billing, ranking, lead credits, migration and measurement beyond raw leads.
PPC Landing Pages: Why Your Ad Clicks Don't Convert (and How to Fix It)
Clicks without business results can point to traffic quality, tracking, the landing page or follow-up. This guide shows how to diagnose the full PPC journey and improve message continuity, mobile use, forms and measurement.


































