
Revenue growth comes from a small set of mechanisms: more qualified demand, better conversion, higher prices or order values, more frequent purchases, stronger retention and expansion into new products or markets. The CEO's job is not to demand more of every metric. It is to identify the current constraint and fund the change most likely to produce incremental contribution margin without creating an unacceptable cash, customer or operational risk.
TL;DR
- Use the equation that fits the business. Ecommerce, subscription and project-based revenue break down differently.
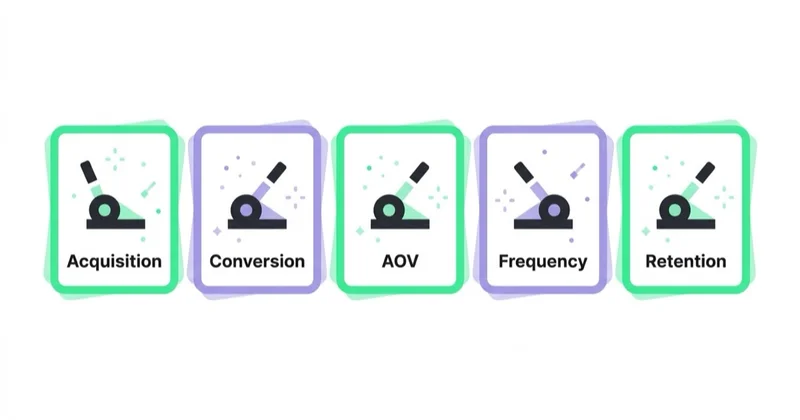
- The practical levers: qualified demand, conversion, price or basket size, purchase frequency, retention and expansion.
- Traffic is not the automatic answer. Additional demand helps only when its marginal contribution remains positive and the operation can fulfil it.
- Revenue is not the objective by itself. Track contribution margin, cash, customer quality and capacity as guardrails.
- Retention is valuable, but not free. Discounts, service and loyalty activity can make some retained revenue unattractive.
- Diagnose and quantify the constraint. Prioritise expected incremental contribution, evidence speed and downside — not the largest percentage gap.
- Isolate effects where practical. Use controlled tests or phased rollouts and document overlapping changes.
Start with the right revenue equation
There is no single revenue equation that is equally useful for every company. Choose a decomposition that does not count the same effect twice.
Ecommerce revenue = purchasing customers × orders per customer × average order value
For a period-level ecommerce view, another useful equation is sessions × ecommerce conversion rate × average order value. Do not add repeat rate to that formula unless sessions and conversion are split by new and returning customers; repeat purchases are already included in total sessions and orders.
For a subscription company, use beginning recurring revenue + new recurring revenue + expansion − contraction − churned revenue. For project-based B2B, use qualified opportunities × win rate × average contract value, then separate renewal and expansion revenue. These equations reveal different constraints and prevent a blended average from hiding the problem.
Multiplicative terms interact. If traffic, conversion rate and order value each genuinely remain comparable, a 20% improvement in conversion and a 20% improvement in order value produce a 44% revenue increase. In practice, the terms rarely stay independent: a price rise may reduce conversion, a promotion may increase orders but lower margin, and broader acquisition may bring lower-intent customers. Model the interactions before treating percentages as additive or guaranteed.
The revenue growth levers and when each fits
| Lever | What it means | Best when |
|---|---|---|
| Acquire more customers | Bring in new buyers | Conversion and value are already strong; demand is the constraint |
| Convert more demand | Turn existing traffic/leads into customers | You have traffic or leads that don't convert |
| Raise average value | Higher price, AOV, or contract size | Customers buy but each is worth less than they could be |
| Increase frequency | More purchases per customer over time | Customers buy once but could buy more often |
| Retain customers | Reduce avoidable churn or improve repeat behaviour | Valuable customers leave for addressable reasons |
| Expand | Add products, use cases, seats, regions or segments | The core offer works and the adjacent opportunity is validated |
Many growth briefs begin with the first lever: get more customers, usually by buying more traffic. Sometimes that is correct. But if new leads are unqualified, the product page creates uncertainty, stock is constrained or customers leave because the product disappoints, more acquisition amplifies the underlying problem. The relevant question is not which metric looks weakest, but which addressable change has the best expected economic return.
When more demand is — and is not — the right move
Acquisition is often highly visible and can become less efficient as spend reaches audiences or queries with lower marginal response. But it is not inherently the most expensive lever. A major product redesign, retention programme or sales transformation can cost more and take longer. Acquisition is attractive when conversion, capacity and unit economics are healthy and credible demand remains available.
The higher-leverage moves are often the unglamorous ones:
- Conversion. Better relevance, evidence, usability or sales follow-up can produce more customers from existing demand. The work still has a cost, and the quality of conversions must remain acceptable. See conversion optimisation across ecommerce, B2B and services.
- Average value. Pricing, bundling and upsell can raise revenue per order, but evaluate elasticity, margin, mix and retention. A higher AOV caused by costly discounts or forced bundles is not automatically progress.
- Retention and expansion. Existing customers may be easier to reach, but service, incentives and success activity are not free. Prioritise customers with positive future contribution and an addressable reason to stay. See lead nurturing without increasing ad budget.
Do not wait for a theoretically perfect funnel before acquiring customers; the business may need real demand to learn. Instead, establish a minimum economic and operational threshold, scale in controlled steps and watch marginal rather than average performance. The customer acquisition economics determine how much room the lever has.
Durable improvements and temporary lifts
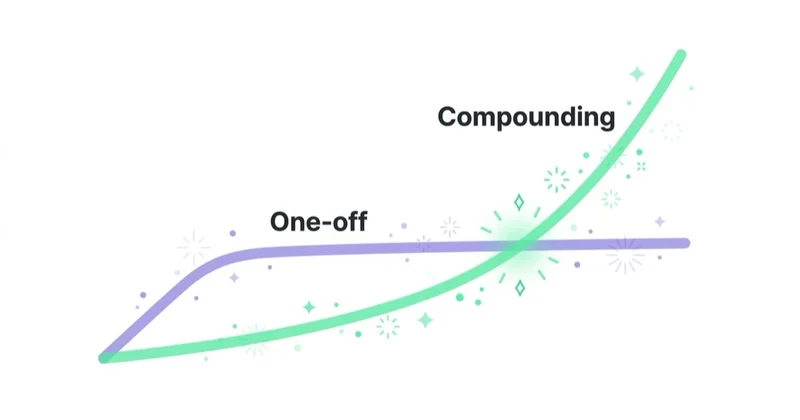
Some changes can persist across periods; others mainly shift timing. A one-off promotion may bring purchases forward from next month, while a clearer onboarding flow may improve several future cohorts. The distinction matters, but persistent improvements still require maintenance: competitors react, customer mix changes, creative fatigues and operational standards can slip.
Leadership should therefore distinguish four effects: genuinely incremental revenue, demand pulled forward from another period, revenue cannibalised from another product or channel, and baseline revenue that would have happened anyway. A conversion increase from 2% to 3% is a 50% relative increase, but it improves future acquisition economics only if traffic quality, margin, returns and the measurement definition remain comparable.
Diagnose the constraint before pulling a lever
Start by locating the binding constraint in the customer and operating system. A low conversion rate may reflect poor traffic, price, availability, a measurement fault or the intended effect of stricter lead qualification. An industry benchmark cannot diagnose which one. Compare segments and cohorts, listen to customers and sales teams, review operational data and verify that the metric is defined consistently.
Rank opportunities using an explicit business case:
- Baseline: what is happening now, by cohort, product and channel?
- Mechanism: why should this change affect customer behaviour?
- Incremental range: what happens compared with doing nothing, including uncertainty?
- Economics: what is the expected contribution after variable and implementation costs?
- Guardrails: what could worsen — churn, refunds, lead quality, cash or service levels?
- Capacity: can sales, fulfilment and customer support absorb the result?
- Evidence: how quickly can the company learn enough to scale, revise or stop?
This whole-system view is what a marketing dashboard should make visible.
Turn each lever into a financial experiment
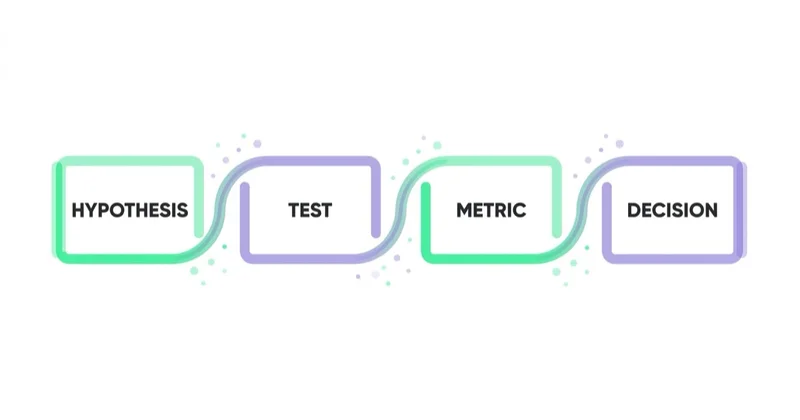
Every growth initiative needs a hypothesis, primary outcome, guardrail metrics, decision window and investment cap. A price increase may lift revenue per order while reducing conversion and retention. More leads can dilute pipeline quality. Higher purchase frequency may pull forward demand that would have arrived later rather than creating new value.
Before launch, define the baseline and expected effect on contribution margin, cash and operating capacity. Use a randomised test, geo test, holdout or credible phased rollout where feasible. A simple before-and-after comparison can confuse the initiative with seasonality, promotions or competitor activity. Where changes must overlap, record them and narrow the claims the analysis can support.
The best lever is not necessarily the one with the largest headline percentage. Priority normally belongs to the action with the strongest expected incremental contribution, acceptable downside, a credible path to evidence and enough room to scale. For paid media, average ROI describes the past; marginal ROI and response curves are more relevant to the next unit of budget.
Glossary
- Revenue equation — a decomposition of revenue into measurable drivers without double-counting the same behaviour.
- Conversion rate — the share of demand (traffic, leads) that becomes customers.
- Average value / AOV / ACV — revenue per customer, order or contract.
- Frequency / repeat rate — how often a customer buys over time.
- Retention / churn — keeping customers versus losing them.
- Constraint — the bottleneck currently limiting the performance of the wider system.
- Incremental revenue — revenue caused by an action compared with the credible outcome without it.
- Marginal return — the expected return from the next unit of investment, not the historical average.
How Space Ads approaches increasing revenue
When a company asks Space Ads to "increase revenue," the request often arrives as "get us more leads" or "more traffic." That may be the right brief, but it should not be assumed. The first step is to connect acquisition data with conversion, margin, sales capacity, returns or churn so the team can see whether additional demand is likely to create profitable growth.
Our approach is to diagnose the commercial system, state which assumptions are evidence and which are hypotheses, then test the most promising lever within financial guardrails. Acquisition is a core capability within performance marketing, but media should scale only while its marginal contribution and downstream capacity support it. When the decision spans pricing, proposition, retention and the wider organisation, it fits a fractional CMO remit rather than a media-only plan.
Stop doing / Do instead
| Stop doing | Do instead |
|---|---|
| Defaulting to "get more traffic" | Diagnose which lever is the actual constraint |
| Scaling from average ROAS | Use incremental contribution and marginal response |
| Treating a promotion spike as growth | Separate incremental, pulled-forward and cannibalised revenue |
| Raising AOV at any cost | Test price and bundles against margin, conversion and retention |
| Retaining every customer | Focus on profitable customers and addressable churn |
| Changing everything without a record | Use tests or phased rollouts and document overlaps |
FAQ
How can a company increase revenue?
Increase qualified demand, improve conversion, raise price or basket size, increase purchase frequency, retain valuable customers or expand into adjacent products, use cases and markets. Use the revenue equation appropriate to the business, then choose the action with the best expected incremental contribution after costs and constraints.
What is the fastest way to increase revenue?
There is no universal fastest lever. A price or packaging change can show results quickly but may damage conversion or retention. Conversion work can unlock existing demand but still requires research, engineering or sales time. Prioritise the shortest credible route to incremental contribution margin, then protect customer, cash and operational guardrails.
Why is buying more traffic often the wrong move?
It is wrong when poor traffic quality, conversion, retention, inventory or fulfilment is the binding constraint, or when marginal acquisition cost exceeds the value created. It is right when unit economics and capacity are healthy and there is unsaturated demand. Test marginal response instead of assuming either answer.
What are compounding revenue levers?
They are improvements whose benefits persist across future periods or cohorts, such as a durable onboarding or checkout improvement. They can be more valuable than a temporary promotion, but they still require maintenance and causal validation. A measured lift should not be projected forever without accounting for changing customer mix and competition.
How do you decide which revenue lever to pull?
Identify the system constraint, explain its cause and compare possible interventions by expected incremental contribution, cost, risk, evidence speed and scalability. Do not select a lever only because it trails an industry benchmark; definitions, traffic mix and business models differ.
Is it cheaper to acquire new customers or grow existing ones?
It depends. Existing customers can be less expensive to reach and may buy with greater confidence, but retention and expansion require product, service, success and sometimes incentives. Compare future contribution by cohort, including the cost to serve and probability the customer would have stayed or expanded without the intervention.
Key takeaways
- Use a revenue equation that fits the model and does not double-count repeat behaviour.
- The practical levers are qualified demand, conversion, value, frequency, retention and expansion.
- Optimise incremental contribution and cash, not revenue or average ROAS in isolation.
- Diagnose the binding constraint and model interactions before choosing an intervention.
- Test or phase changes, protect guardrails and scale according to marginal response.
Sources
- Google Meridian — Incremental outcome, marginal ROI, and response curves
- The CMO Survey — 2026 report on growth, budgets, and marketing productivity
- UK Competition and Markets Authority — Price transparency guidance
Continue learning
- Customer acquisition cost benchmarks by industry
- Conversion optimization across ecommerce, B2B and services
- Lead nurturing: convert more leads without increasing ad budget
- What % of revenue should you spend on marketing?
- Performance marketing as one lever among several
- Fractional CMO: choosing which lever the business pulls
Continue reading
Customer Acquisition Cost Benchmarks by Industry (and What a 'Good' CAC Really Is)
There is no universal 'good' customer acquisition cost. CAC only means something next to gross margin, lifetime value and payback period — and against your own model, not a benchmark. This guide explains how to calculate it correctly and how to read industry numbers without being misled.

Lead Generation for Online Courses and Education Providers
Education lead generation must connect an honest promise with learner fit, enrolment and course starts—not just form volume. Learn how to design the journey, evidence claims and measure each intake.
Cost Per Lead (CPL): Benchmarks, What's 'Good', and How to Set Your Target
CPL is easy to calculate and easy to misuse. Learn how to compare valid benchmarks, separate media CPL from fully loaded CPQL, and derive an affordable target from your own unit economics.


































