
Marketing attribution assigns conversion credit to eligible marketing touchpoints. Google Ads, Meta, GA4 and the CRM can report different numbers because they observe different interactions and apply different event definitions, identities, clocks, lookback windows and credit rules. Some differences are expected; others reveal broken tracking or inconsistent configuration. Attribution supports channel optimisation, but attributed credit is not the same as incremental impact. Executives need a measurement portfolio: financial and CRM facts for business outcomes, analytics for journeys, platform reporting for delivery, and well-designed experiments or carefully specified marketing-mix models for higher-stakes allocation decisions.

TL;DR
- Attribution credit is not causation. A model answers which eligible touchpoint receives credit under its rules, not what would have happened without the activity.
- Dashboard differences have multiple causes. Model choice matters, but so do event definitions, time basis, identity, consent, deduplication, refunds and implementation defects.
- Last-click gives the final eligible interaction all credit. This can underrepresent earlier touches, but its bias depends on the journey and the channels the system can observe.
- Data-driven attribution is still modelled credit. Its usefulness depends on available paths, eligible channels, configuration and the decision being made.
- Adding platform-reported conversions overstates the shared total. Platforms use different windows, eligible interactions, and identity signals, so the same order may appear in several reports.
- Experiments can estimate causal lift when their design and execution are valid. MMM can estimate incremental effects, but causal interpretation depends on model structure, controls and assumptions that data alone cannot fully test.
- Executives should triangulate, using the method whose scope, uncertainty and speed fit the decision.
- The goal is better decisions, not a perfect number that does not exist.
Why the dashboards disagree
If Google Ads reports 100 conversions, Meta reports 80 and an analytics platform reports 140 total key events, do not add the platform figures or assume one report is correct. First confirm that the tools describe the same business event and period. A platform may include view-through interactions, use conversion-time or interaction-time reporting, model unobserved events or apply a different lookback window. The same order may receive credit in more than one platform, while consent or identity gaps may prevent another system from observing it at all.
Attribution is an assignment problem. A buyer sees a social ad, later searches the brand, clicks an email and buys. A last-click model credits the email, a first-click model credits social, a linear model splits credit and a data-driven model estimates weights from the paths available to it. These are model outputs, not direct observations of causal contribution. Differences caused by those rules are expected; duplicate purchase events, lost identifiers or inconsistent revenue values are defects that should be fixed.
Once a leadership team internalises this, the frustration of "why don't the numbers match?" turns into the right question: "which view should we trust for which decision?"
Align the data scope before debating the model
Changing an attribution model will not reconcile reports that describe different sets of events. Before evaluating a channel, align at least six variables:
- Conversion definition — a purchase, qualified opportunity, and raw form submission are different outcomes.
- Business source — the ad platform, GA4, CRM, billing system, or commerce backend.
- Reporting time — interaction date versus conversion date.
- Lookback window — how long a touchpoint remains eligible for credit.
- Eligible interaction — click, engaged video view, or view-through exposure.
- Identity and consent — which journeys can be joined across devices and which events are observed or modeled.
GA4 adds another source of confusion: attribution depends on dimension scope. Session-scoped dimensions continue to use paid and organic last click, while event-scoped dimensions use the property's selected reporting model, which is data-driven by default. Two reports in the same property can therefore differ without either being broken.
The operating rule is simple: reconcile the numerator, denominator, scope, and clock before comparing attribution models. Otherwise, a debate about credit hides a more basic data-contract problem.
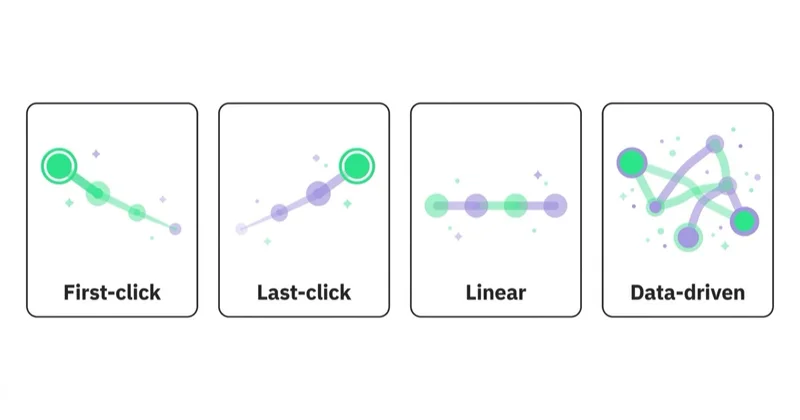
The attribution models and what each hides
| Model | How it assigns credit | Main limitation |
|---|---|---|
| Last-click | All credit to the final eligible touch | Earlier eligible interactions receive no credit |
| First-click | All credit to the first eligible touch | Later interactions receive no credit |
| Linear | Even split across observed touches | Equal weighting is imposed, not learned |
| Time-decay | More credit to recent touches | The decay rule is assumed |
| Position-based | Most credit to first and last | The weights are fixed in advance |
| Data-driven | Modelled weights from available paths | Output depends on observable or modelled data, eligibility and methodology |
First-click, linear, time-decay, and position-based remain useful concepts for diagnosing bias, but Google removed them from GA4 and Google Ads in 2023. GA4 now offers data-driven, paid and organic last click, and Google paid channels last click; Google Ads supports data-driven and last click. A legacy dashboard may therefore name a model that is no longer selectable in the current product.
Last-click is simple and reproducible, but it gives earlier eligible touches no credit. In a journey where social or video creates awareness and branded search closes the visit, that can make the earlier activity look less valuable. It does not always over-credit branded search, and GA4's paid-and-organic last-click model normally excludes direct visits unless the path consists entirely of direct visits. Treat a last-click view as one bounded lens and test material decisions rather than infer that the final touch caused the sale.
Data-driven attribution estimates weights from converting and non-converting paths rather than imposing one fixed rule. Whether it is more useful than last-click depends on the question and the quality and coverage of the input data. It is not the same as running a campaign-level randomised holdout. Its output depends on paths the system can observe or model, channels eligible for credit and the selected lookback window, and it does not reconcile independent platform claims.
What attribution cannot answer — and what can
The question executives actually care about is causal: did this spend cause incremental revenue, or would that revenue have happened anyway? Attribution cannot answer this, because it only distributes credit among touches that preceded conversions it can see — it never observes the counterfactual.
Two methods are used to estimate incremental effects, with different evidence requirements:
- Incrementality testing — withholds treatment from a valid control group, such as users or comparable geographies, and compares downstream outcomes. A causal interpretation requires a suitable randomisation or assignment method, sufficient power, limited contamination, stable measurement and analysis that matches the design.
- Marketing-mix modelling (MMM) — uses aggregate observational data to estimate how media and other factors relate to a business outcome over time and geography. Causal interpretation requires explicit assumptions, including adequate control of confounding factors. Good predictive fit alone does not validate channel ROI.
These methods can provide stronger allocation evidence than a credit-setting debate, but neither automatically answers every budget question. An experiment estimates the treatment and period it tested; an MMM extrapolates through a response model and its assumptions. Use uncertainty ranges and combine experiments with MMM where feasible. The methods are covered in incrementality testing and marketing-mix modelling.
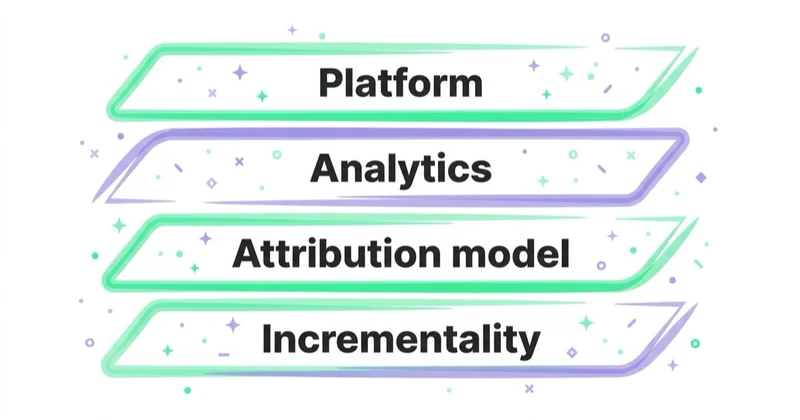
A four-layer measurement system
A mature measurement system does not force one report to answer every question. It combines four layers that challenge and calibrate one another:
| Layer | Best question | Typical decision | Main limitation |
|---|---|---|---|
| Finance system / CRM | How much revenue, margin, and new-customer value actually occurred? | Company performance | Does not isolate channel impact by itself |
| GA4 / product analytics | How do users move through and convert on the site or product? | Funnel and journey improvements | Consent, identity, and dimension-scope gaps |
| Ad platforms | Which campaigns and signals help the delivery system achieve its objective? | Daily campaign optimization | Platform-specific view and credit rules |
| Experiments and MMM | Which outcomes may be incremental, and how might spend respond? | Budget allocation and scenarios | Design, assumptions, uncertainty, scale, time and data quality |
A “source of truth” is appropriate for an accounting fact, such as recognized revenue. It is not a complete explanation of causality. The CRM cannot observe every ad exposure, while an ad platform does not know full contribution margin or how much demand would have converted without advertising. Each layer therefore needs a declared role, owner, refresh cadence, and decision threshold.

How to reconcile conflicting marketing reports
When the gap becomes materially larger than normal, use a fixed diagnostic order:
- Confirm the base volume in the CRM, billing system, or commerce backend. This validates actual outcomes, not marketing credit.
- Compare the same event definition. Separate primary outcomes from micro-conversions and qualified opportunities from raw leads.
- Align time zone, currency, tax treatment, refunds, and order status. A gross-versus-net difference can masquerade as attribution drift.
- Check report scope and reporting time. Interaction-time and conversion-time reports answer different questions.
- Record the model, lookback window, and eligible interaction types for every tool. Without this measurement contract, the comparison cannot be reproduced.
- Audit identity and deduplication. UTMs, click IDs, transaction IDs, event deduplication, and CRM joins determine how much of the journey can be connected.
- Interpret the remaining gap only after the controls pass. Unexplained variance should not automatically be labelled a platform error.
This sequence turns a recurring dashboard argument into an auditable process. More importantly, it separates instrumentation defects from legitimate differences in model scope.
Glossary
- Attribution — assigning credit for a conversion across the touchpoints that preceded it.
- Last-click — a model giving all credit to the final touch before conversion.
- Data-driven attribution — a model estimating credit weights from observed conversion patterns.
- Incrementality — the additional outcome caused by spend versus what would have happened without it.
- Marketing-mix modelling (MMM) — statistical modelling of spend-to-outcome relationships over time.
- Counterfactual — what would have happened absent the marketing, the thing attribution never observes.
How executives should actually use attribution
The mature stance is not to pick a winning model but to use each tool for the decision it fits.
- Use platform reporting to optimise within its scope, while checking that the chosen conversion and value reflect business quality. Platform data is operationally useful, but changes should be evaluated against CRM, contribution and holdout evidence where available.
- Use MER and blended views as whole-business controls, not causal channel measures. They avoid summing platform-attributed conversions but can still move because of price, promotions, organic demand, channel lag or non-media factors. See MER vs ROAS.
- Use well-designed incrementality tests for material causal questions when a valid holdout and adequate power are possible.
- Use a carefully specified MMM for portfolio scenarios, exposing priors, controls, response curves and uncertainty, and calibrating with experiments where appropriate.
The failure mode is using one tool for everything: making a cross-channel budget decision from last-click alone, treating a blended ratio as channel causality, or using a periodic MMM for daily creative decisions. Match the method to the decision's scope, stakes, reversibility and speed.
How Space Ads approaches attribution
We start by agreeing the business outcome with the leadership team: recognized revenue, contribution margin, a new customer, or a sales-qualified opportunity. We then verify that GA4, the CRM, and ad platforms receive the intended event with a stable identifier and no duplication. Only after that do we compare models and lookback windows. Platform data steers daily campaign decisions; CRM outcomes and blended metrics control the whole business. For a material budget reallocation, we recommend an incrementality test or MMM when scale and data history make the method credible. The reporting layer keeps disagreements visible instead of blending them into false precision, so decision-makers can distinguish a transaction fact, modeled credit, and an estimate of causal impact. This is the measurement foundation behind our web analytics, performance marketing, and fractional CMO work.
Stop doing / Do instead
| Stop doing | Do instead |
|---|---|
| Treating one attribution model as the truth | Triangulate — different tools for different decisions |
| Making cross-channel budget decisions on last-click alone | Use experiments and assumption-aware MMM where feasible |
| Assuming an earlier touch created demand | Test a material causal claim with a valid holdout |
| Summing platform-attributed conversions | Reconcile actual outcomes and use MER as a defined control |
| Arguing over attribution settings | Specify the decision and choose evidence that can answer it |
| Accepting every discrepancy as normal | Separate expected scope differences from tracking defects |
FAQ
What is marketing attribution?
Marketing attribution is the practice of assigning credit for a conversion to the marketing touchpoints that preceded it. Because a customer journey usually spans several channels, attribution uses a model — last-click, data-driven, and others — to decide how to split the credit. It is an estimate based on assumptions, not a measurement of cause.
Why do Google, Meta and analytics report different numbers?
They can use different conversion definitions, identities, eligible interactions, lookback windows, time bases and credit models, while observing different parts of the journey. The same order may receive credit in several platforms. But discrepancies can also indicate duplicate events, missing IDs or inconsistent values, so reconcile scope and implementation before calling the difference expected.
What is wrong with last-click attribution?
Last-click gives all credit to the final eligible interaction and none to earlier eligible touches. That can underrepresent earlier activity in a multi-touch journey, but the size and direction of the bias depend on the journey and observable channels. GA4 normally excludes direct traffic from last-click credit unless the path is entirely direct.
Is data-driven attribution better?
It can be more informative because it estimates weights from available converting and non-converting paths instead of applying a fixed rule. It remains modelled attribution within a defined data scope. It does not by itself reconcile independent platforms or provide the same evidence as a campaign-level holdout experiment.
How should executives measure marketing?
Triangulate. Use finance and CRM for actual business outcomes, analytics for journeys, platform reporting for in-platform delivery, MER as a defined whole-business control, valid experiments for material causal questions and assumption-aware MMM for portfolio scenarios. Report uncertainty and match the method to the decision's scope and speed.
What is the difference between attribution and incrementality?
Attribution distributes credit among eligible touchpoints under a model. Incrementality compares outcomes under treatment with a valid estimate of the counterfactual, often using a holdout group. With adequate design and execution, it estimates the outcome caused by the tested activity for that population and period.
Key takeaways
- Attribution assigns credit under a defined model; it does not establish campaign-level causation.
- Dashboard differences can be legitimate scope differences or correctable implementation defects.
- Last-click excludes earlier eligible touches; data-driven attribution remains dependent on its available paths and configuration.
- Valid experiments provide the strongest causal evidence for the treatment tested; MMM estimates depend on explicit and partly untestable assumptions.
- Executives should triangulate business facts, journey analytics, platform operations, blended controls, experiments and MMM.
Sources and further reading
- Google Analytics Help — Attribution and currently available models
- Google Analytics Help — Traffic-source dimension scopes and their attribution models
- Google Analytics Help — Reporting model, eligible channels, and lookback-window settings
- Google Ads Help — Attribution models in Google Ads
- Google for Developers — Meridian open-source marketing mix modeling
- Google for Developers — MMM as a causal-inference methodology and its required assumptions
- Google Ads Help — About Conversion Lift
- Meta Marketing Science — Robyn open-source marketing mix modeling
Continue learning
- Incrementality testing: geo experiments across Meta and Google
- Marketing-mix modelling with Meridian and Robyn
- MER vs ROAS: the blended metric your board should track
- Server-side tagging and the Conversions API
- Web analytics that ties spend to revenue
- Fractional CMO: measurement a board can decide on
Continue reading
Marketing Attribution Models: Last-Click vs Data-Driven
Last-click and data-driven attribution distribute credit differently; neither proves causal impact. Learn what Google Ads and GA4 currently support, why reports disagree and how attribution fits with experiments and MMM.

Why Is My ROAS Dropping? The Usual Suspects, in Order
A ROAS decline can come from reporting, media cost, traffic mix, conversion, order value or a changed business context. Use this diagnostic sequence to protect downside, compare mature data and isolate the real driver.
Brand Strategy vs Performance: How Brand Work Actually Shows Up in Revenue
Brand building and sales activation serve different time horizons, but neither belongs to a single channel. Learn how to set objectives, use the 60/40 finding responsibly, connect brand indicators to commercial outcomes, and measure incremental impact.


































